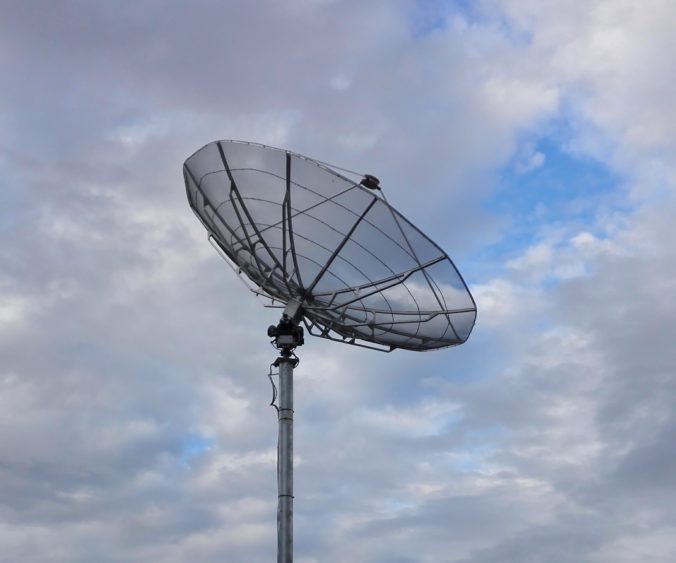
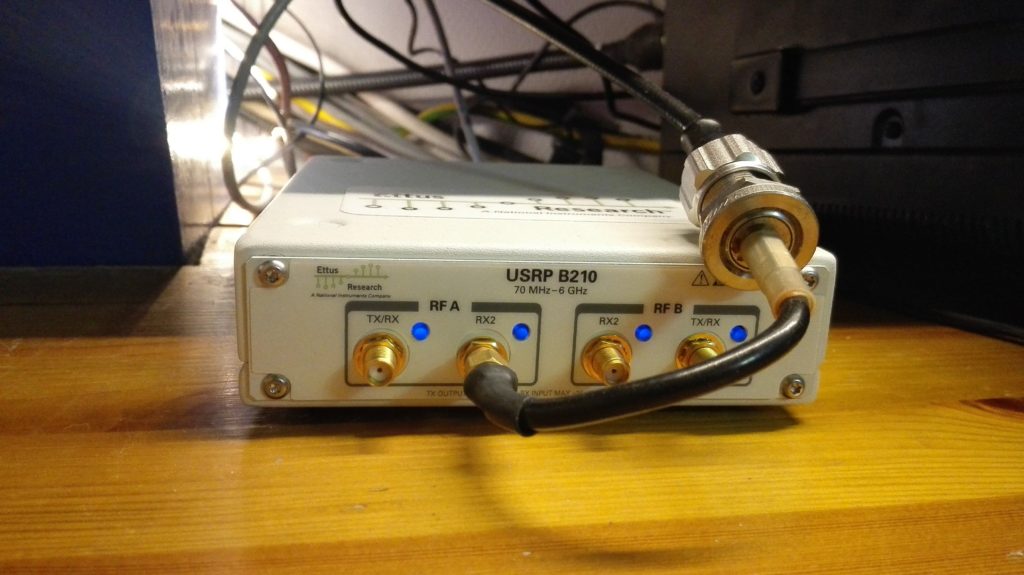
After having increased the sturdiness of the rotor, and installed the five-band ring dish feed and a 23 cm LNA in the dish, we have been able to get to a point where we could test the parabolic dish properly using one of our USRP devices.
Initial measurements against LA2SHF during test operation at its test site had shown good reception of the signal using the parabolic dish. LA3WUA performed a rough, initial calibration of the rotor controller, and the next steps were to:
- Test other methods for calibration, against e.g. geostationary satellites transmitting close to 23 cm.
- Test against ON0EME.
- Run our first 23 cm EME QSO using the parabolic dish.
LA3WUA did receive something reminiscent of INMARSAT 3F2, but the first experiment was mostly unsuccessful. We reduced the complexity from artificial satellites to our natural satellite, the moon, in order to reduce the possible sources of errors. LB6RH and LA3WUA then went on to track the moon and try to receive ON0EME. This was also unsuccessful, despite multiple attempts, and we were starting to suspect that there was something seriously wrong with the parabolic setup.
Luckily, LA2SHF had, as mentioned, been put into test operation. In order to test the parabola, we did a couple of rough, manual measurements for different azimuthal directions against LA2SHF in carrier wave mode. The results were rather dejecting, as we couldn’t see the very clear directional pattern we should expect for the dish. However, LA2SHF is currently not placed in a very good location for these kinds of measurements. We don’t have guaranteed line of sight (LOS) against it, and buildings or hills in-between might interfere with measurements and cause fading effects. It is very likely that the signal we were measuring is a signal that has been reflected off the ground or in-between buildings, and such a signal arriving from multiple sources is expected to fade in and out due to different path lengths.
We therefore wanted to do a systematic measurement of the apparent antenna pattern against a signal source placed at a point with guaranteed LOS. This was something we planned to do last weekend, but ended up being postponed to this or the next week due to the following:
In order to make the measurements objective and systematic, and in order to more conveniently measure the system before and after modifications, we wanted to automatize the measurement process. We have in an earlier blogpost done similar, manual measurements, but this is very time-consuming. Even the first measurements mentioned above were time-consuming and confusing. A couple of analysis tools were therefore developed for the purpose:
- A GNU Radio flowgraph for continuously measuring the reception power of the carrier wave from the USRP and outputting samples and timestamps to file.
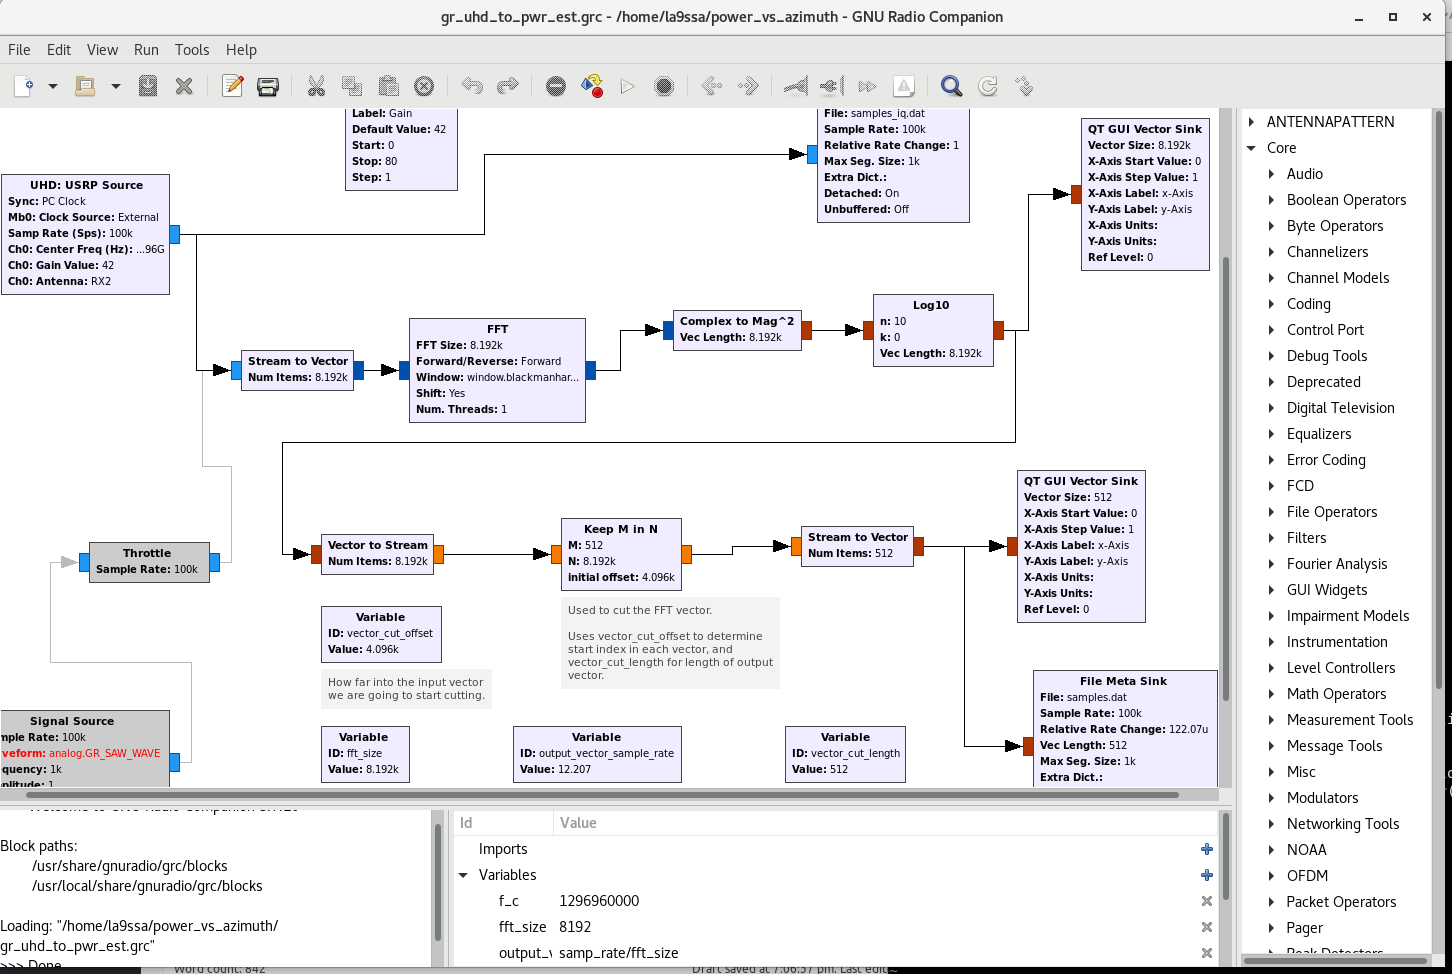
Preliminary GNU Radio flowgraph.
- A script for continuously logging timestamps and corresponding azimuth angles to file, enabling us to do a sweep of the rotor over larger angle ranges and let the script automatically record the angles:
la9ssa@ark-shack00:~/power_vs_azimuth$ python rotctld_angle_printer.py
 timestamp                   azimuth      elevation
 2018-02-10T12:56:31.086758  150.000000   5.000000
 2018-02-10T12:56:45.392412  150.100006   5.000000
 2018-02-10T12:56:45.445934  150.200012   5.000000
 2018-02-10T12:56:45.517160  150.299988   5.000000
 2018-02-10T12:56:45.570634  150.399994   5.000000
 2018-02-10T12:56:45.624031  150.500000   5.000000
 2018-02-10T12:56:45.695345  150.600006   5.000000
 2018-02-10T12:56:45.748729  150.700012   5.000000
 2018-02-10T12:56:45.820043  150.799988   5.000000
- A collection of scripts for interpolating the recorded azimuthal angles against the timestamps of the GNU Radio samples in order to obtain azimuth-resolved power estimates, and some preliminary methods for estimating the reception power:
import combine_samples_and_angles as comb
angles = comb.read_angles('angles.dat')
timestamps, samples = load_gnuradio_samples('gnuradio_samples.dat')
interpolated_azimuth = comb.interpolate_azimuth(timestamps, angles)
power = comb.power_estimate(samples)
Developing such software from scratch turned out to take a bit more time than expected, and we had to postpone the measurements in order to be certain that we had no systematic deviations in the measurements themselves. However, after an intense weekend of development, debugging and testing, we were finally satisfied with our tools. We were thus able to systematically measure the current state of the parabolic system against the current location of LA2SHF without having to do any manual labor except for starting the scripts and starting a sweep of the rotor.
These results, characterizing the current state of the parabolic dish as measured against a rather uncertain signal source without proper LOS, are shown below:
Time series of the beacon signal and noise level while rotating the parabolic dish from 150 to 250 degrees azimuth.
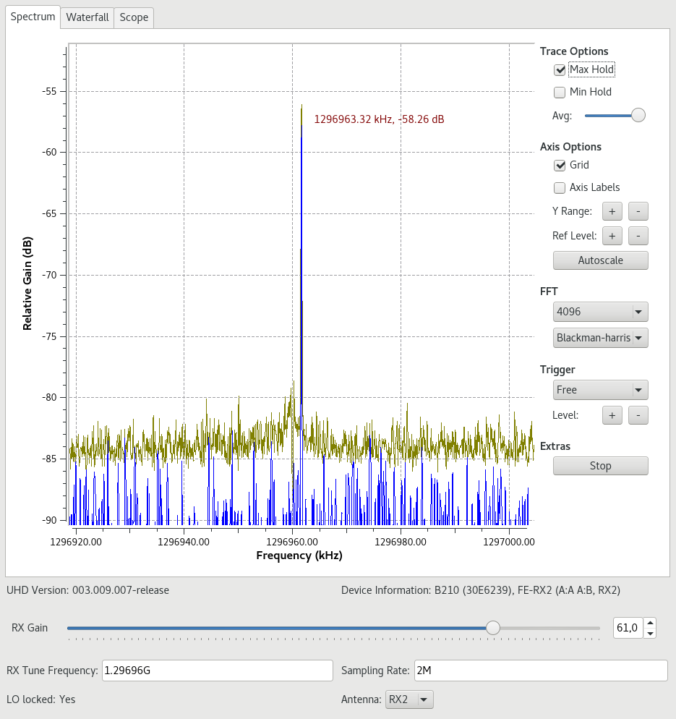
Measuring the beacon for different azimuth angles shows that the signal is above the noise level, and that we can clearly see the beacon signal using the parabolic dish. The signal is approximately ~35 dB above the noise level at best, which is the same as we measured when LA2SHF was put into use.
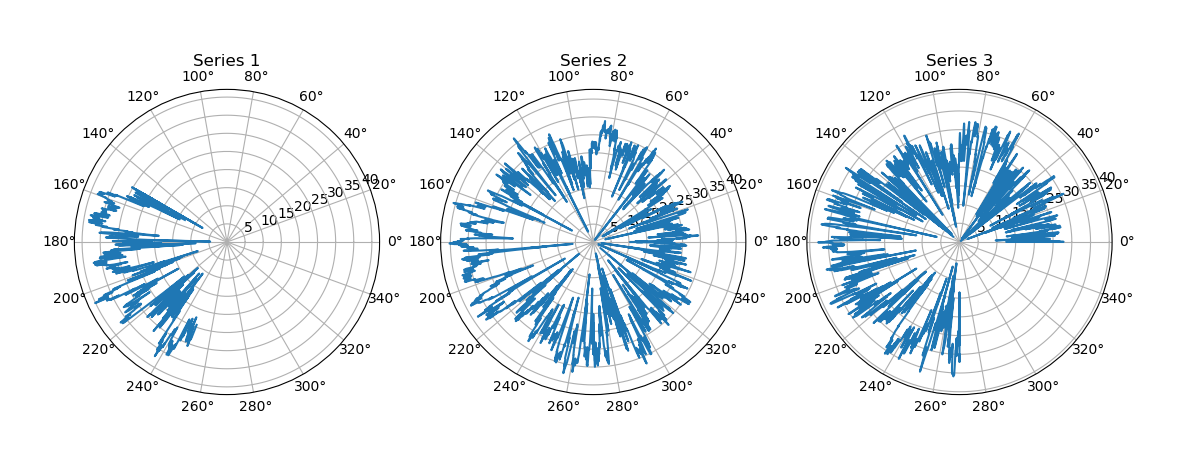
Antenna patterns during three measurement series.
Putting these measurements in a polar diagram shows a rather noisy antenna pattern. We can, from approximately 160 degrees to 200 degrees azimuth, see some reminiscence of an antenna pattern proper and some hints of lobes. At the other angles, it probably looks more like a porcupine than anything else. The measurements are also slightly inconsistent from series to series.
The reason for the inconsistency might be the fading and multi-path interference effects mentioned earlier, as we can clearly see the signal fading in and out in the FFT plot while rotating the antenna (seen as blue stripes in the constant beacon signal):
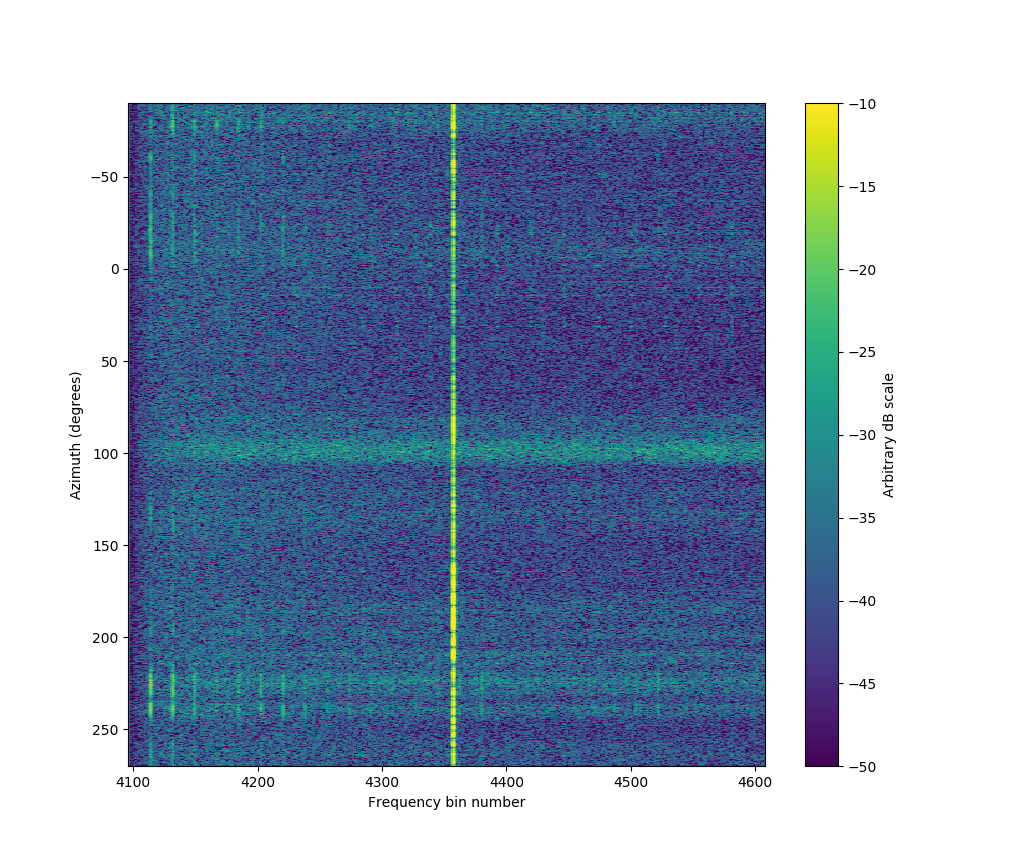
We also compared against measurements done at a constant azimuth degree:
Measurements for rotation compared against measurements for constant azimuth angle.
Interestingly, we observe signal level fluctuations even when the parabolic dish is not rotating. Typically, we would expect this behavior only when the antenna sees different multipaths due to movement.
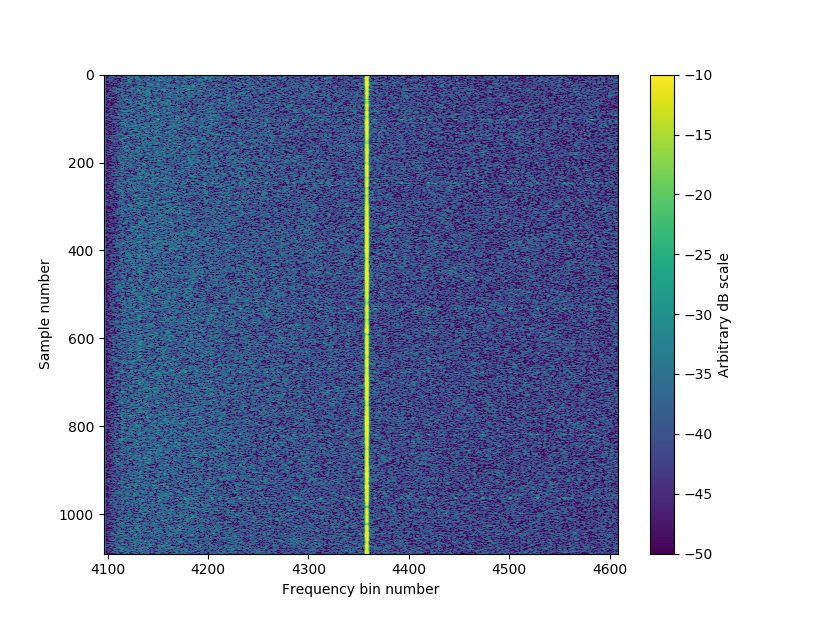
FFT plot of measurements done at constant azimuth angle 160 degrees.
Possible causes for this could be the SDR dropping packets, the LNA losing power supply intermittently, or large and moving objects (such as cars) intersecting one of the major propagation paths. We will know more when we get to measure with direct LOS and compare against a test feed constructed for the purpose by LA3WUA.
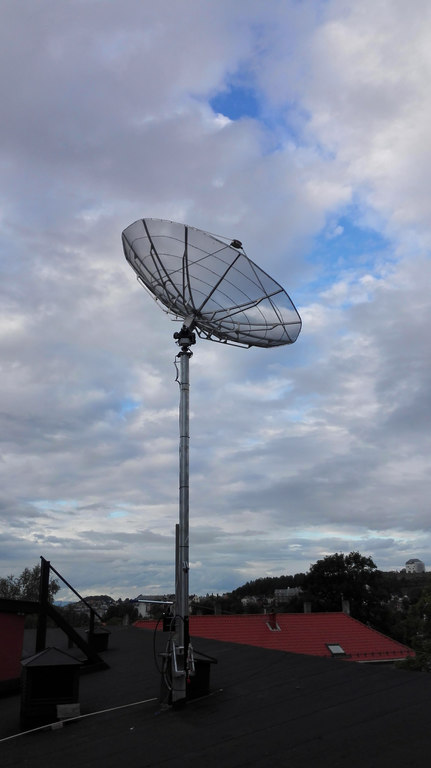
The parabolic dish after construction last year. Kristiansten Festning is the white building on the top of the hill in the background (right).
The chosen site is Kristiansten Festning, where we have free LOS from the parabolic dish. We will set up a portable antenna and some kind of carrier wave signal source. Once verified, or once debugged, we should be able to continue with our verification steps, and continue the development of the 1-10 GHz system.
In our stage three post about the 1-10 GHz project, we promised an LNA and driver amplifier within November last year. Since then, everything has been ominously quiet. It turned out that we had to secure additional funds, and had to divert our efforts for a while as we tried to find new sponsors. We are glad to announce that we have gotten WideNorth on board as a sponsor for the project.
WideNorth specializes in RF and analogue design, signal processing and product development. This fits well with the expertise ARK-members end up getting through their studies, and as such is a natural partner for us in this endeavor. WideNorth has this to say about our project:
The ARK broadband project matches the WideNorth philosophy where theoretical skills and practical abilities are brought together to produce exciting products and interesting solutions. WideNorth wishes the ARK team good luck in their endeavor to develop a working broadband receiver and trust that ARK will put the funds to good use.
We are looking forward to the collaboration!

This is an interesting article. I am working on a receiver in GNURadio to measure the signal strength in time for a number of beacons. I have built the GNU Radio flow graph in the article for continuously measuring the reception power of the carrier wave. However, how can I convert the output of the File Meta Sink to readable ascii characters?
Thanks for the comment! 🙂 We were planning to get back to both the GNURadio flowgraph and the Python code for reading back the samples in a later blog post, where we’ll go more into detail and give the source code and stuff.
Given that you make the file metasink write the header to a separate file (“detached header”), the main datafile will contain only the samples, organized sequentially in the original datatype. These can be read back directly into an array in most programming languages, using ‘fread()’ or similar functions.
For reading the raw IQ samples in ‘samples_iq.dat’, this could for example in Python be done using:
import numpy as np
samples = np.fromfile(‘samples_iq.dat’, dtype=np.complex64)
This will be a one-dimensional array containing complex values, each array position corresponding to a sample as acquired from the USRP source.
For the log power spectrum data that is written to ‘samples.dat’, they could be read using:
samples = np.fromfile(‘samples.dat’, dtype=np.float32)
In our flowgraph, the last data here are actually in vector format, so the array needs to be reshaped to a matrix in order to be interpreted correctly:
samples = np.reshape(samples, (-1, vector_length))
, with vector_length specified to the vector length the flowgraph used. Here, the samples are along the row dimension, while the vector length will be along the column dimension.
We’ve now added the details on both flowgraph, reading and analysis in https://www.la1k.no/2018/05/16/using-gnu-radio-and-hamlib-to-calculate-antenna-diagrams/.
Many thanks you for the explanation. It works here now.