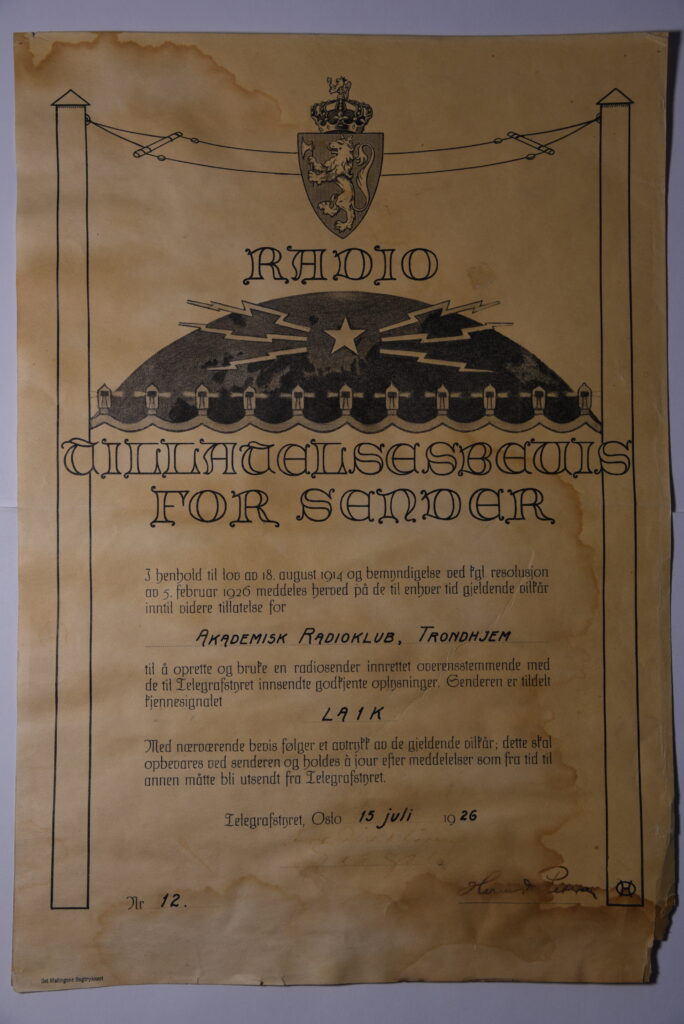
Our club was founded in 1923 and for the centennial anniversary in 2023 we held a special banquet and transmitted using the special call “LA100K“. In it’s infancy, the Norwegian radio clubs didn’t have call signs, as it wasn’t yet issued in Norway, and transmitting was heavily regulated. But 100 years ago to this day, ARK recieved it’s callsign “LA1K” on the 15th of July, 1926.
instead of hung up by the transmitter – which is written!
ARK can’t lay the claim to being the oldest radio club in Norway, or even being the longest continously operative one. Clubs such as “Bergens Radio Amatør Klub”, (now “Bergensgruppen” of NRRL) was founded in 1922 and is still going strong. However, we are pretty certain that we have callsign with the longest contionous use in all of Norway, as prior issued callsigns were given to operators that has since passed and have since been reissued. Apart from World War II until the 26th of April 1946, LA1K has been disturbing the peaceful airwaves constantly.
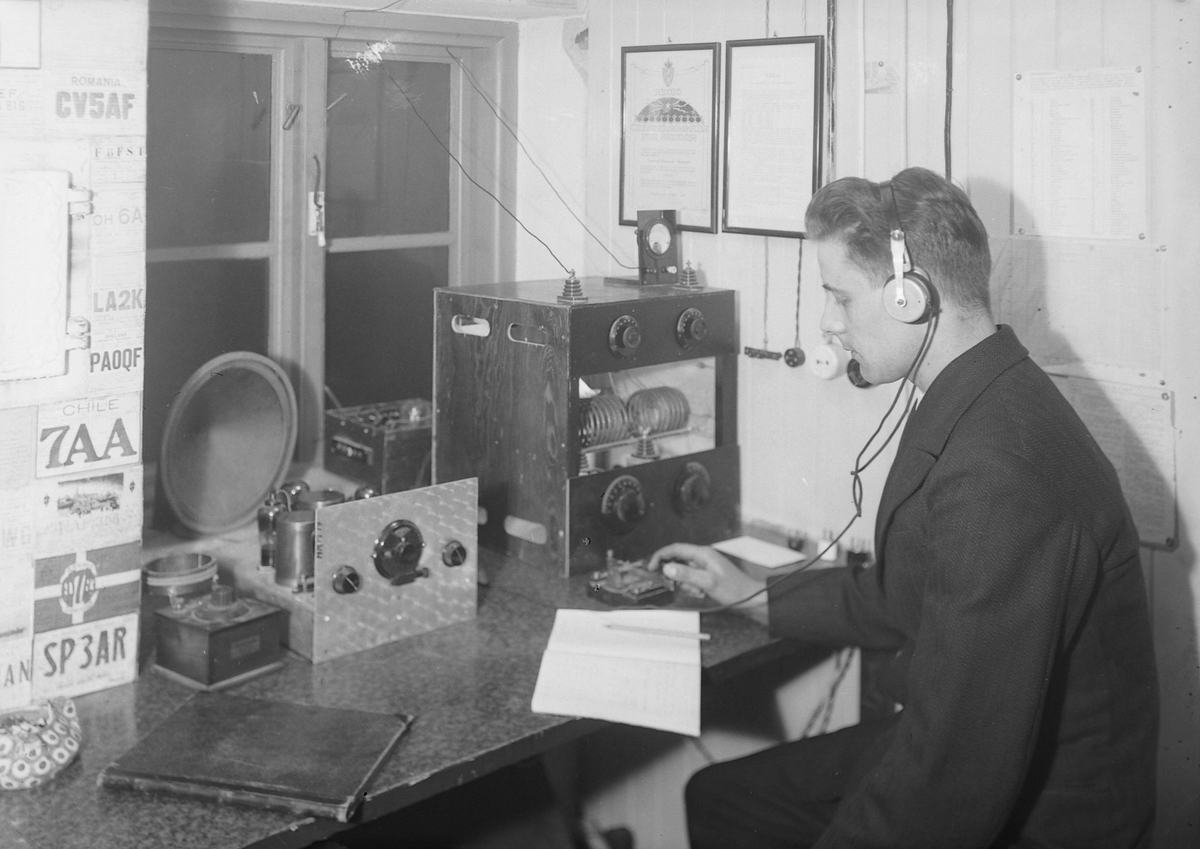
Here in March 1933 with Oddvar Johannesen, Station Manager
Photo: Schrøder / Sverresborg Folkemuseum
There has also been an rumour going on for years that “LA1K” was the third callsign issued in Norway, with LA1A Johannes Diesen and LA1W Ragnvald N. Pedersen being the two first. From the author’s knowledge, this comes from the 1987 curriculum and may be false, as our issued permit clearly states “No. 12, 15. Juli 1926”. If any historians has any further info on the matter though, we would be very interested to hear about it!
It would also be interesting to know how the call “LA1K” ranks in terms of logged QSOs of all time in Norway. But with the big contest stations like “LN8W” doing their fair share of contesting, we have to be humble (for once) and say that this is one statistic we may have been beaten!