As part of a sub-project for my master’s thesis I performed some antenna pattern measurements on three amateur radio yagi antenna systems in Trondheim. An antenna pattern is useful when evaluating the characteristics and performance of an antenna.
The sub-project for my master’s thesis originally concerned ionospheric scintillations on satellite downlinks in the 144 MHz and 430 MHz amateur radio bands, and ground stations were built/modified to measure these effects. During verification of the ground station setups we evaluated the antenna patterns of the ground station antennas. This is repeated in this blog post as it may be of interest to other amateurs.
-
- LA1K’s four bay array of 21 element LFA antennas from InnovAntennas.
-

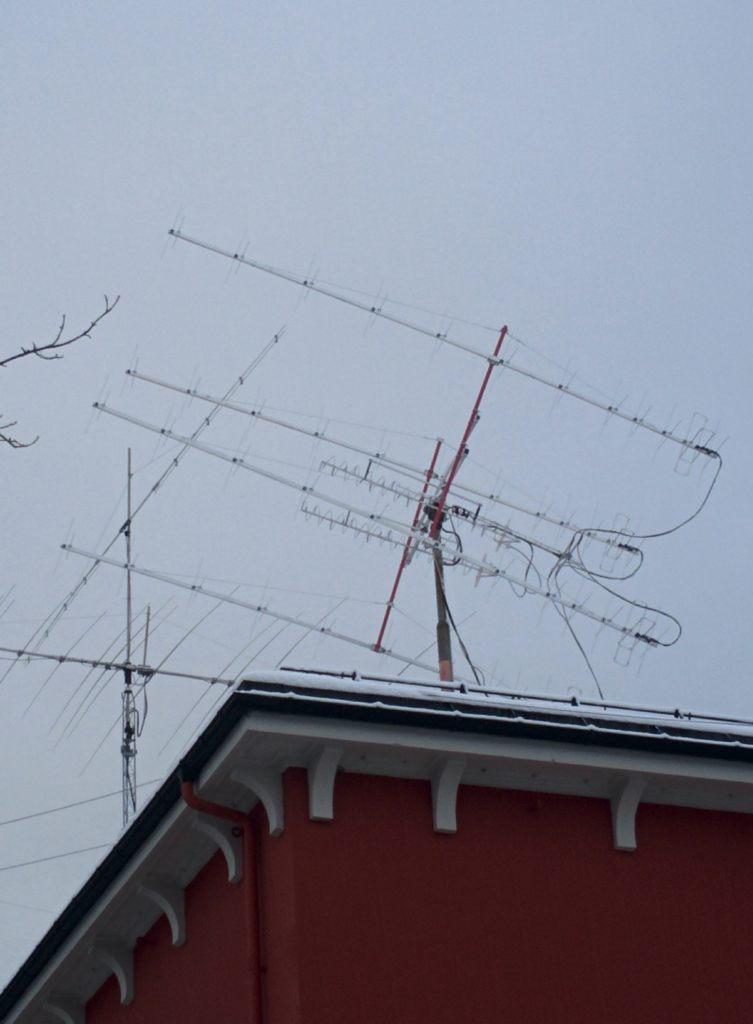
- NTNU Test Satellite (NUTS) Ground station antennas. Tonna 2×9 (right) and 2×19 (left).
The antennas we measured on is a newly (late 2016) erected four bay loop fed array (LFA) antenna from InnovAntennas, and 2×9 and 2×19 crossed Tonna antennas for 144 MHz and 430 MHz respectively. The Tonna antennas are part of the NTNU Test Satellite (NUTS) ground station.

Height curve between NUTS ground station and LA2VHF beacon at Vassfjellet. The distance is sufficiently large so that the 800 m height difference causes only a 1-2 degree take off angle tilt.
Each of the CW beacons at Vassfjellet sends a morse code sequence, e.g. “LA2VHF JP53EG”, followed by a 10 seconds long CW tone. The measurement is performed by logging the signal power during the long CW tone after each beacon sequence, and rotating the test antenna step by step. The process is repeated for each antenna position in 4 degree increments. Once the antenna has rotated 360 degrees, an antenna pattern is derived. Although all of the antennas have access to both vertical and horizontal polarization, we chose to measure only the horizontal polarization of the antennas due to the polarization of the beacon antennas (horizontal). This measurement method allows for far field measurements when the frequency is below approximately 1000 MHz. Below 1000 MHz the far field distance is so large that is becomes impractical to construct an anechoic chamber, which we have used in a previous posts[1][2] on measuring antenna patterns. This method would be essential if we ever want to measure the patterns of our HF antennas.
-
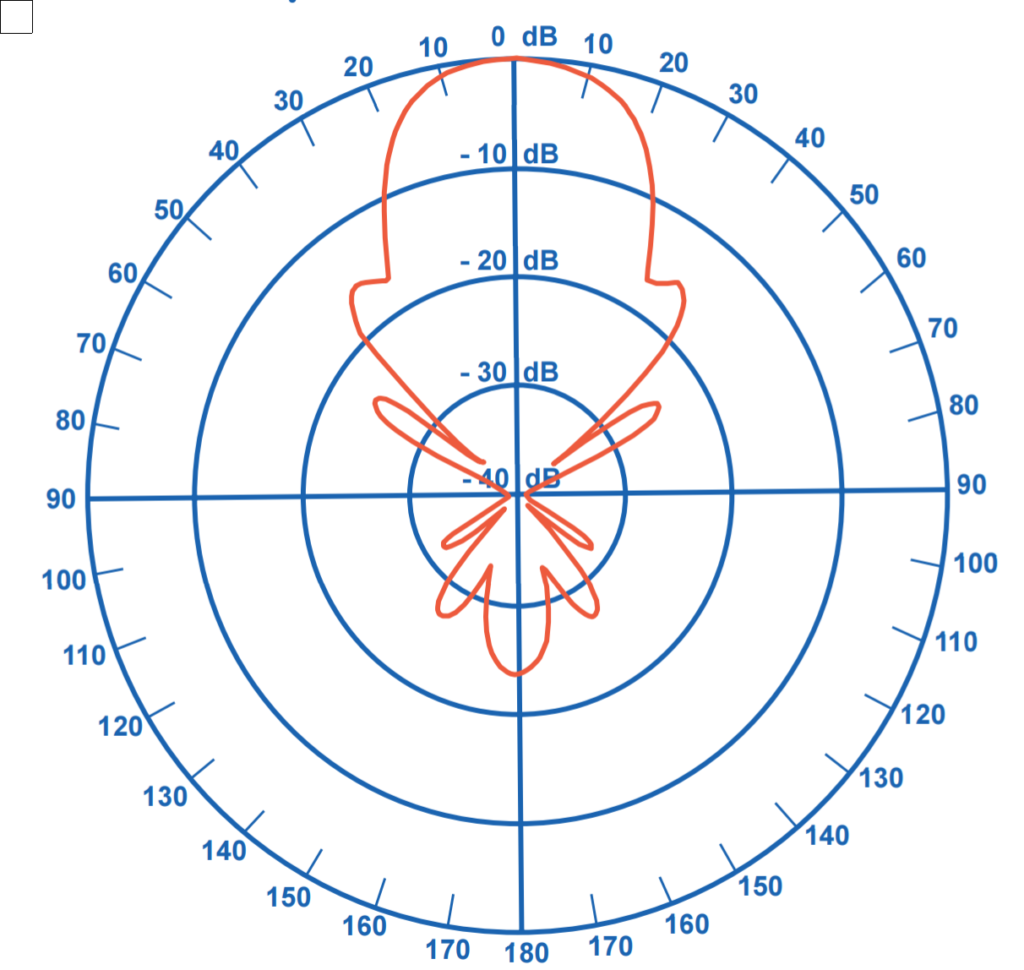
- Datasheet antenna pattern for 2×9 144 MHz Tonna yagi.
-
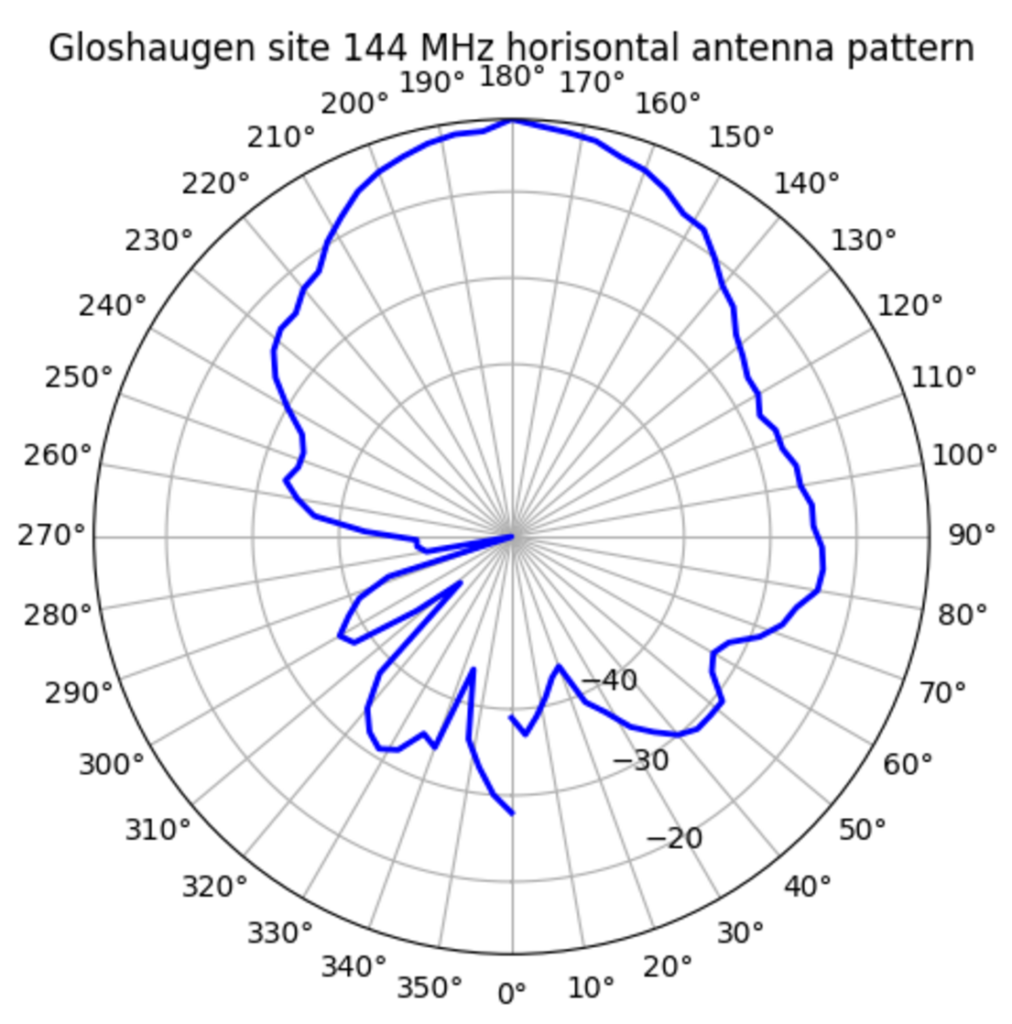
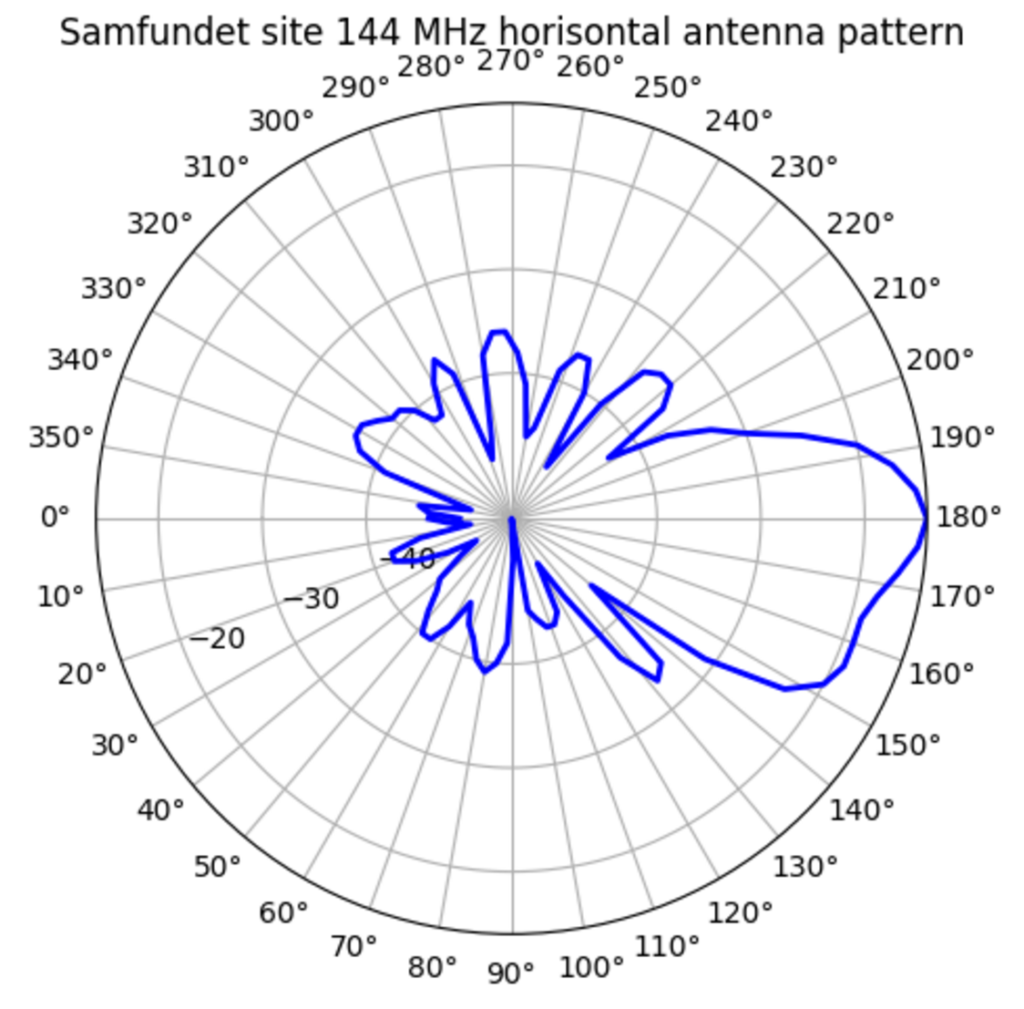
- Measured antenna pattern for horisontal part of 2×9 144 MHz Tonna yagi.
-
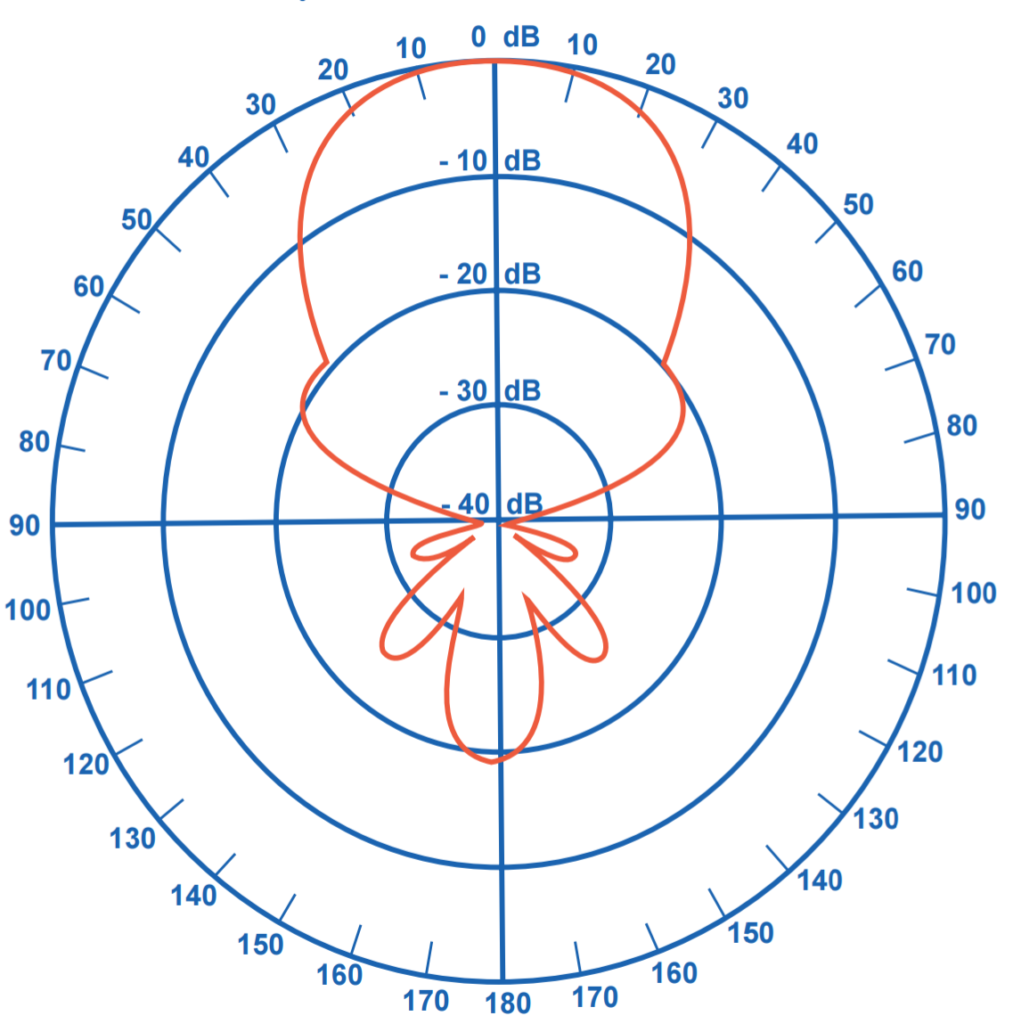
- Datasheet antenna pattern for 2×19 430 MHz Tonna yagi.
-

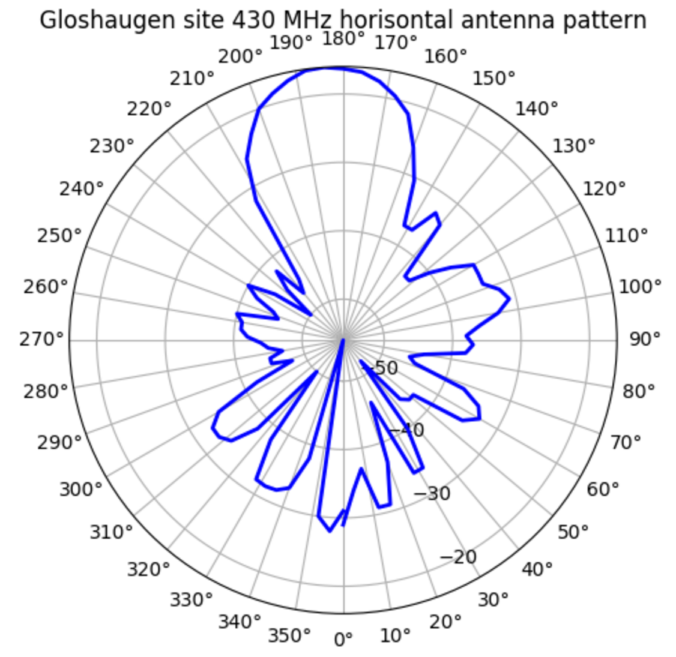
- Measured antenna pattern of a Tonna 2×19 antenna for 430 MHz.
-
- Measured antenna pattern for 4 bay LFA array antenna. No datasheet is available for comparison of the antenna pattern.
The measured antenna patterns seen in the figures above correlate fairly well with the expected results. Some artifacts are expected due to the measurement method, for example the pattern is very likely to include errors caused by reflections in the nearby environment. One example in the antenna patterns for the 2×9 and 2×19 yagis is a strong lobe between 120 degrees and 20 degrees. At these angles there is a large hillside that could explain the reflections. The 4 bay array shows a large squinting main lobe that could be caused by a large ventilation aggregate located next to the antenna.
To get better results a second transmitter at a different location could be utilized. If the pattern is the same as during the first measurement it is likely the actual pattern that was measured. At the points where it deviates it would be possible to perform an analysis to figure if a lobe occurs due to reflections. But the most important improvement would be to automate the process to avoid measurement bias and fatigue. With the current setup each measurement took about 40 minutes of manual labor.


How was the signal strength measured? S-meter or audio signal? Using the audio signal into a computer, with AGC turned off, perhaps?
The signal strength was measured by a USRP B210 software defined radio that I moved between ARK and NUTS for the measurements. To get the values from the B210 I made a simple GNURadio-companion flowchart that plots signal strength vs time and prints the current value.
The flowchart I used did not perform any level control. The AD9361 circuit that the B210 uses has a hardware AGC, but this is turned off by default.