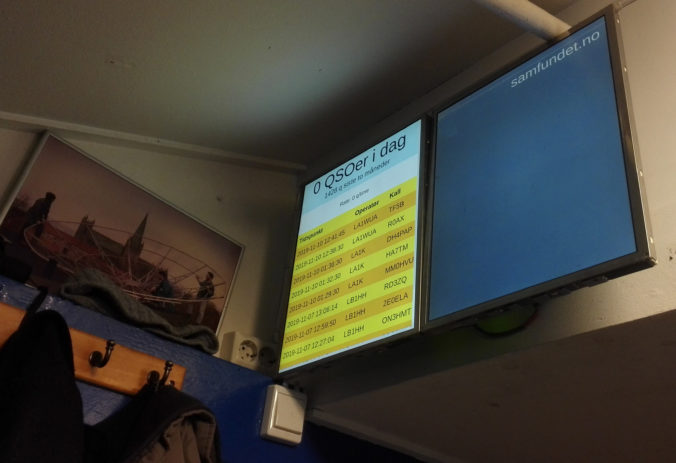
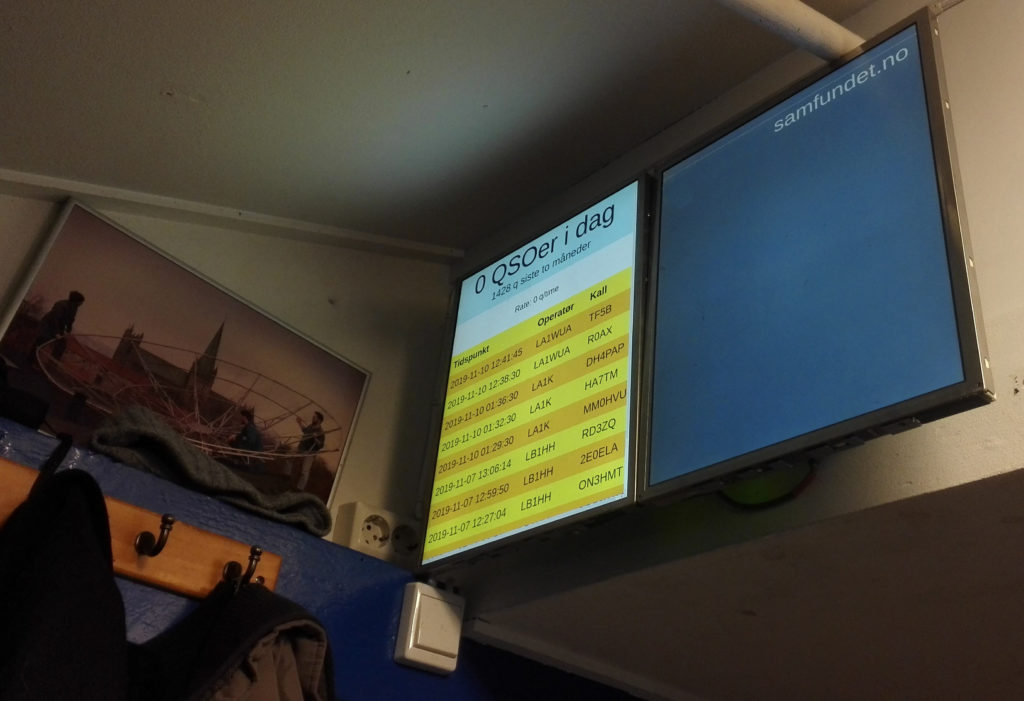
The observant ARK member will during the last months have noticed that live QSO statistics have appeared on the information screens that are mounted at ARK’s club locales.
Having finalized a central database for receiving QSOs from N1MM, as outlined in an earlier blog post, we could finally do what we’ve wanted to do for a long time – put up live QSO statistics. Development of a convenient database and the fact that LB3YH had made a robust RPi setup means that most of the work was already done, and we just had to find out what to display.
The payload of the RPis is a full-screen chromium instance displaying a static web page. We therefore had to implement some dynamic web page thing displaying the last QSO statistics based on the current database information.
Luckily, we have already familiarized ourselves with flask, a web server framework written in Python. Since we could run this locally on the RPi in order to display the information on the same RPi, we could throw all security considerations out of the window and do a quick and dirty implementation.
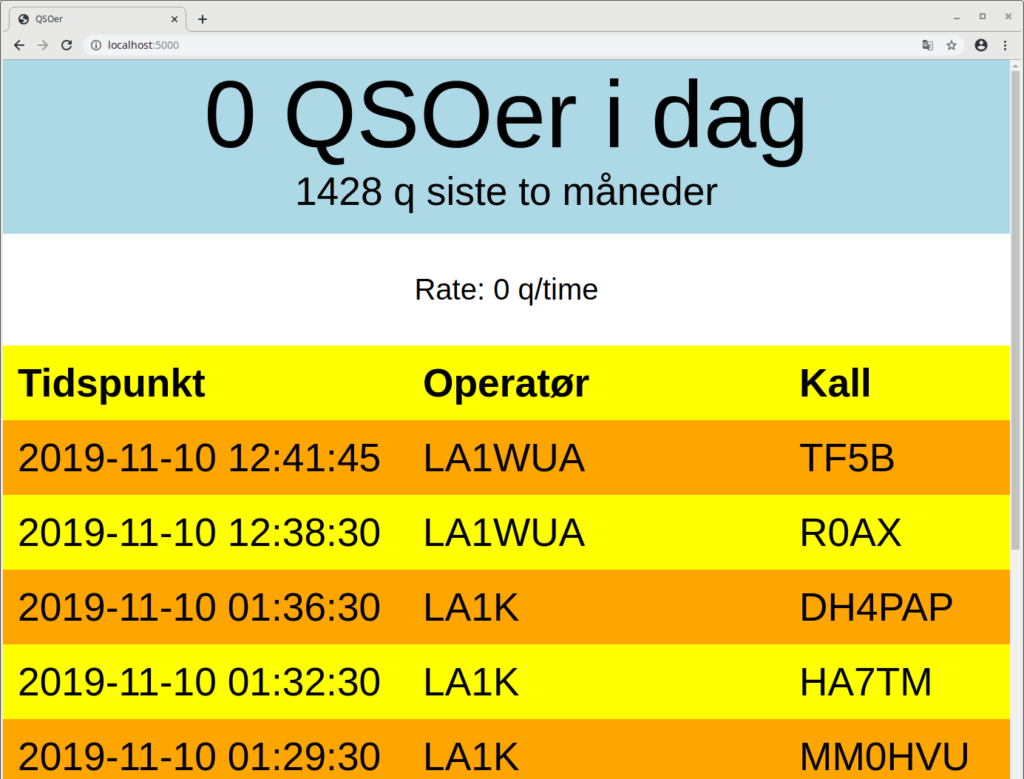
We’ve put this up at https://github.com/bjorgan/qso_web_view. Running python3 main.py connects to the QSO database and sets up a web server. Navigating to the HOST:PORT of this webserver then displays the last QSOs and some statistics like rate and the number of QSOs over the last two months.
We’ve quickfixed the dynamics of the situation by writing a simple Javascript oneliner in the HTML template to refresh the page once per five seconds, which makes the webserver serve up fresh QSO statistics every five seconds.
The last QSOs are easily obtained by running a simple SELECT statement against the QSO database. The number of QSOs today, and throughout the last two months, are also easily obtained by a SELECT and COUNT statement. The rate is not as straight-forward, but we found a working method:
- Select the timestamps of the QSOs run throughout the last hour
- Calculate the mean rate (number of QSOs per hour) as the number of QSOs over the time range between the first and last QSO.
This yields the correct rate when running with an even rate over a hour, and yields the correct extrapolated rate at the beginning of an hour given that the same rate is used throughout the entire hour.
We fit our QSO statistics viewer into the existing RPi system by making it open a new tab displaying the QSO page. The tabs of the browser session are then cycled with some waiting time at each tab in order to display multiple information screens.
Making chromium/chrome cycle tabs or open new tabs without using the GUI directly, and doing it automatically, is not straight-forward, and we had to write our own CLI interface for controlling the web browser. We’ve also put this up on GitHub at https://github.com/bjorgan/chromium-control.
These monitors have been a great help in visualizing the contacts that are made (or not made) every day at ARK. In the future we hope to improve it further by adding live plotting of contacts on a world map and maybe some high-scores.
A final note: Similar solutions for visualization of live QSO statistics based on N1MM sniffing exist, like https://github.com/n1kdo/n1mm_view. These didn’t fit our arbitrary purposes, but might be well worth checking out in general.

Leave a Reply