As mentioned in the post on our future ADS-B setup we have conducted a series of measurements on amateur radio low noise amplifiers (LNAs). I had the opportunity to spend some time at NTNUs microwave laboratory while working on my masters thesis. Some of these results and figures are also presented in the thesis (“Ground station considerations for the AMOS satellite programme”, Øyvind Karlsen, NTNU, 2017). This post shows how we measured the Noise Figure (NF), Gain, Third-order intercept (TOI/IP3), spurious free dynamic range (DR_f) and insertion loss of the LNAs in the figure below.
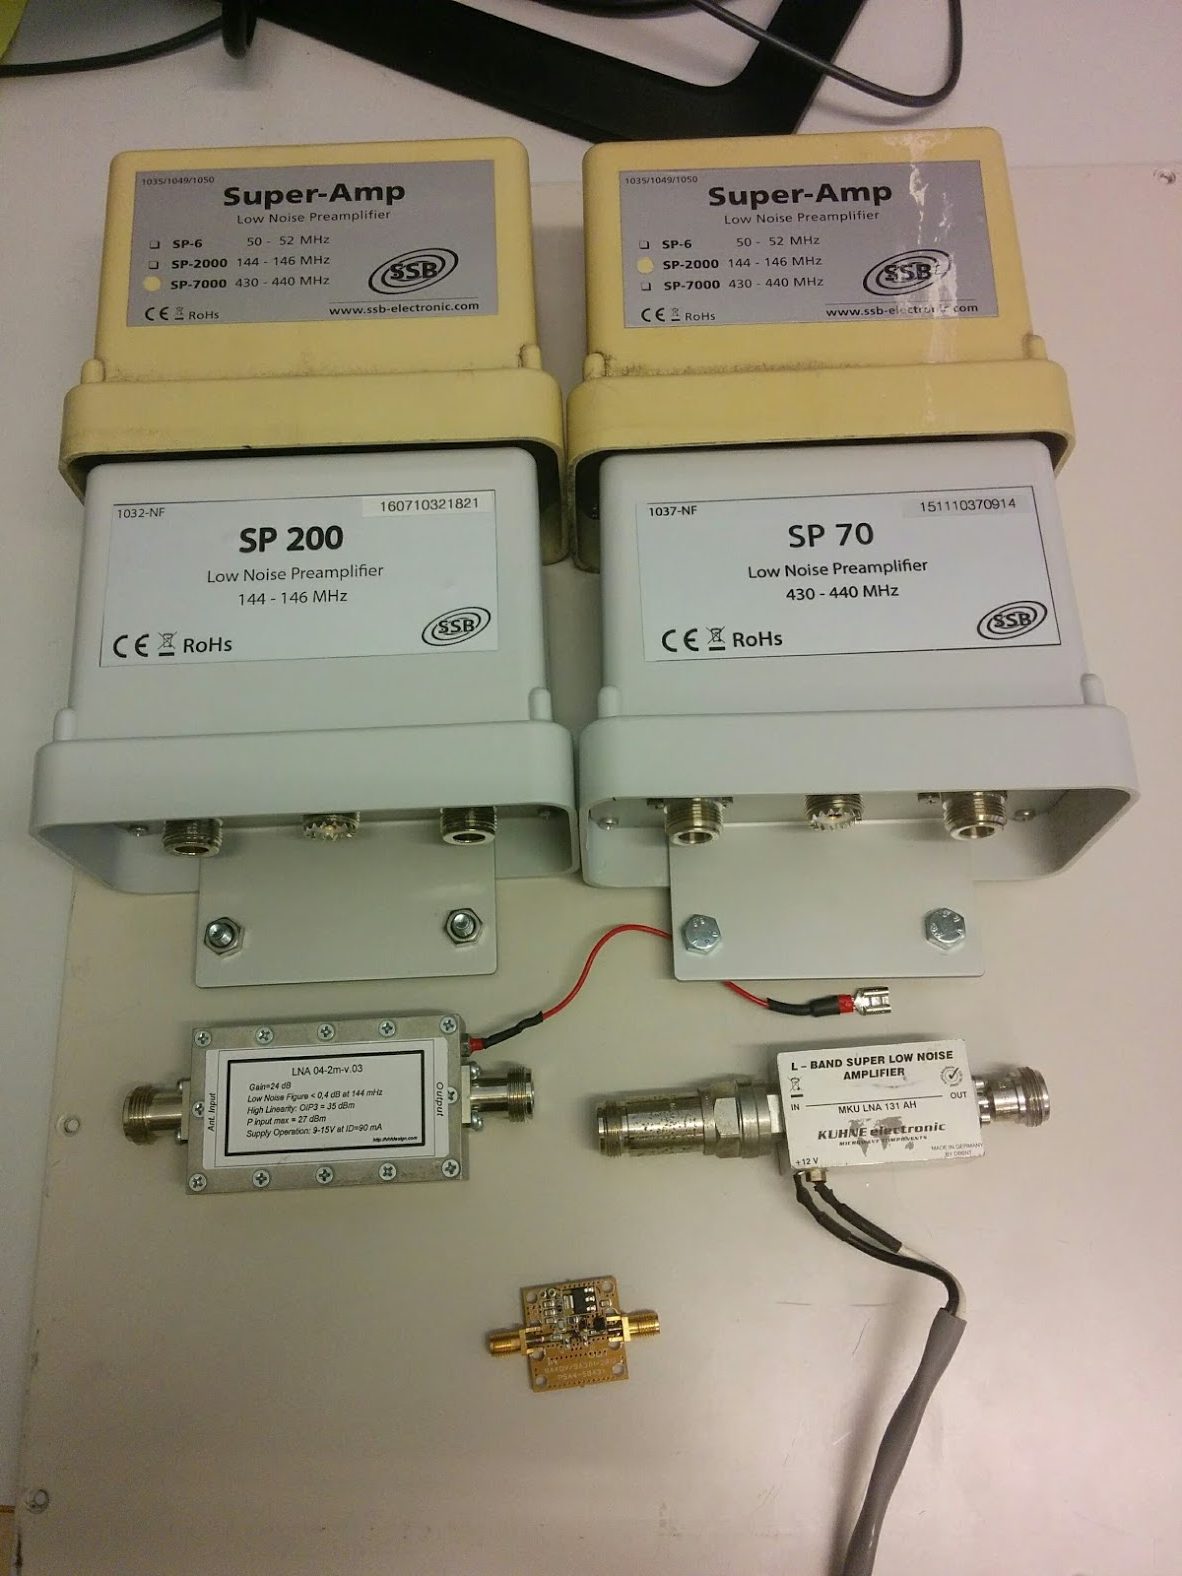
LNAs under test. From top left to bottom: SSB-Electronic SP-7000, SP-2000, SP-200, SP-70, VHFDesign.com LNA 04-2m-v.03, Kuhne MKU LNA 131 AH and LNA4ALL
To start I would like to elaborate which characteristics are important for a LNA and how to measure them. If you are more interested in the results, feel free to skip ahead by clicking this link. The LNAs under test are:
SSB-Electronic:
– SP-7000 (432 MHz)
– SP-2000 (144 MHz)
– SP-70 (432 MHz)
– SP-200 (144 MHz)
VHFDesign.com:
– LNA 04-0m-v.03 (144 MHz)
Kuhne:
– MKU LNA 131 AH (1296 MHz)
LNA4ALL:
– LNA4ALL @ 5 V (30 MHz to 2000 MHz)
A simple way to check if LNAs are working, is to turn on the power supply with a multimeter inline. The multimeter should then be able to read that the LNA is drawing the amount of current specified in the datasheet.
By toggling on and off the power to the LNA there should also be an observable increase of the noise floor at the receiver compared to when the LNA is off. To get a better idea of how they contribute to receive performance more sophisticated measurements must be made.
For all measurements an Aim-TTi EL302Tv precision power supply is used to power the LNAs. All devices are operated at 12 V, except the LNA4ALL which is operated at 5 V.
Noise figure and gain analysis
The noise figure of an active component describes how much noise it adds to an incoming signal. The noise and gain performance of the first stage in a receiver is particularly important as it contributes the most to the system noise figure. The background for this lies in Friis formula for noise, for a more thorough explanation see this link. Using the FSV-K30 option on a R&S FSQ signal analyser together with a HP 346B noise source, the gain and noise figure of the LNAs can be measured. The measurement setup is seen the figure below.
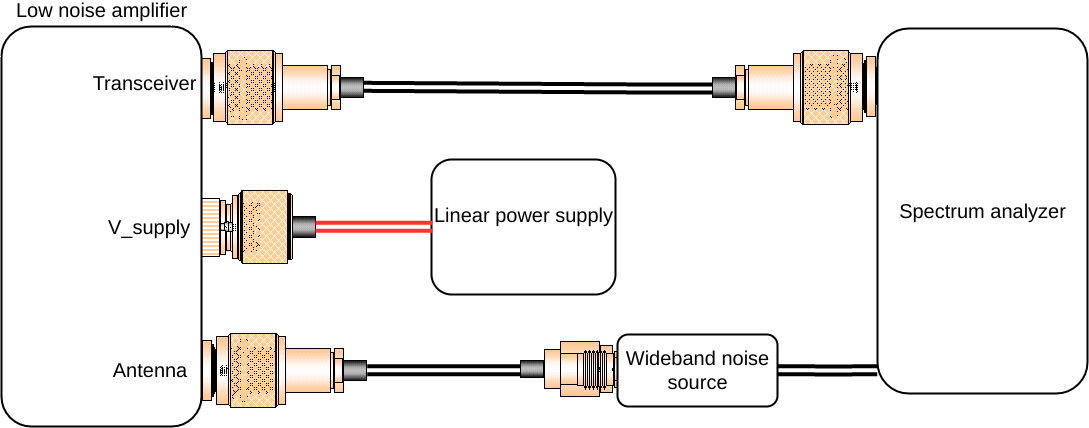
Gain and NF measurement setup
The measurement works by having a wideband noise source, which is a device with a very precise noise contribution over a large frequency range, connected and calibrated to a spectrum analyzer (in this case called a signal analyzer). The noise contribution of this noise source is listed in a table at the back of the device, as seen below.
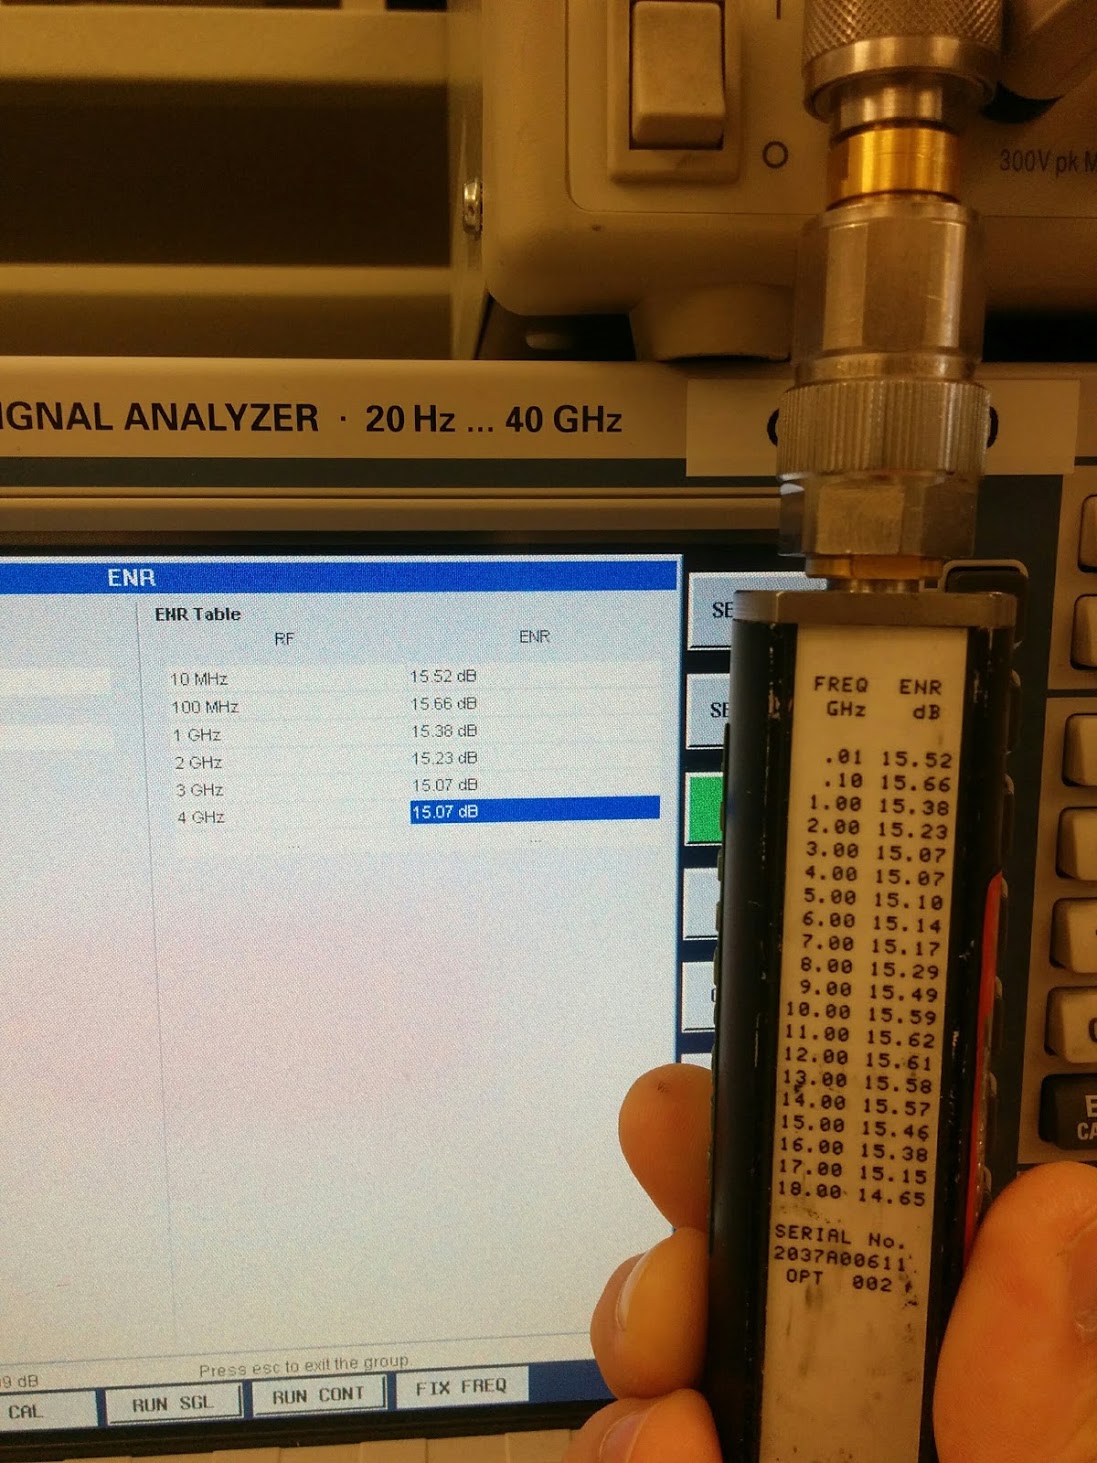
Signal analyzer calibration procedure. Noise source table shown on the back of the noise source to the right.
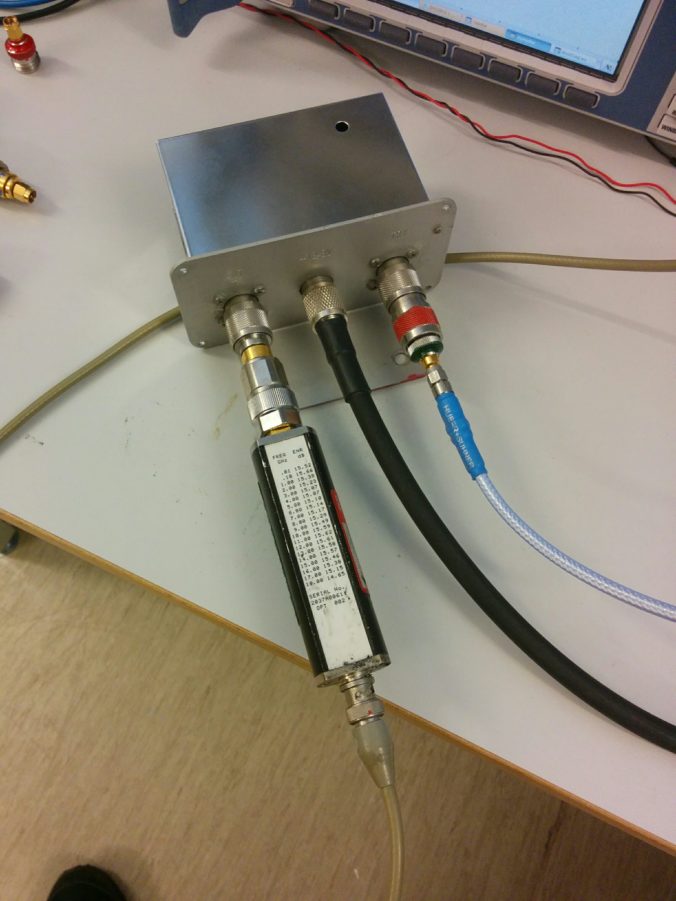
Once the spectrum analyzer is calibrated to the noise source, the noise source is connected to the input of the device under test (DUT). The output of the DUT is then connected to the spectrum analyzer. The resulting signal measured at the spectrum analyzer will now be the amplified noise from the noise source. Since the power level and noise contribution of the source is precisely known it is possible to calculate both noise and gain of the DUT.
This is where option FSV-K30 makes the measurement very simple. The signal analyzer sweeps and calculates automatically, the output is a plot of both noise figure and gain vs frequency.
These measurements are very temperature sensitive. They are done at room temperature, and for thermal stability the equipment is powered on for an hour before starting measurements. Furthermore, the signal analyser is regularly re-calibrated to the noise source.
The SSB-Electronic LNAs feature adjustable gain by tuning a potentiometer. Each LNA is tested for three cases: maximum position, middle position and minimum position.
Linearity analysis
The linearity of a LNA will limit what signals it can reliably amplify. Any active device will generate spurious emissions, for a LNA the close-by intermodulation products that occur between two or more tones in close proximity are the most detrimental. We will show two linearity measures that originate from the third order intermodulation product (IM3) of a two tone test, third order intercept point (TOI or IP3) and Spurious Free Dynamic Range (SFDR or DR_f).
The n-th order intercept point (IPn) is where the n-th order intermodulation-product (IMn) crosses the linear growth curve. This is commonly used as a measure of linearity for non-linear devices, and a higher IPn value is better. Since our devices are highly linear, the measurement is noise floor limited beyond third order intercept (IP3). The relation between the two tone test and IP3 is shown in the figure below.
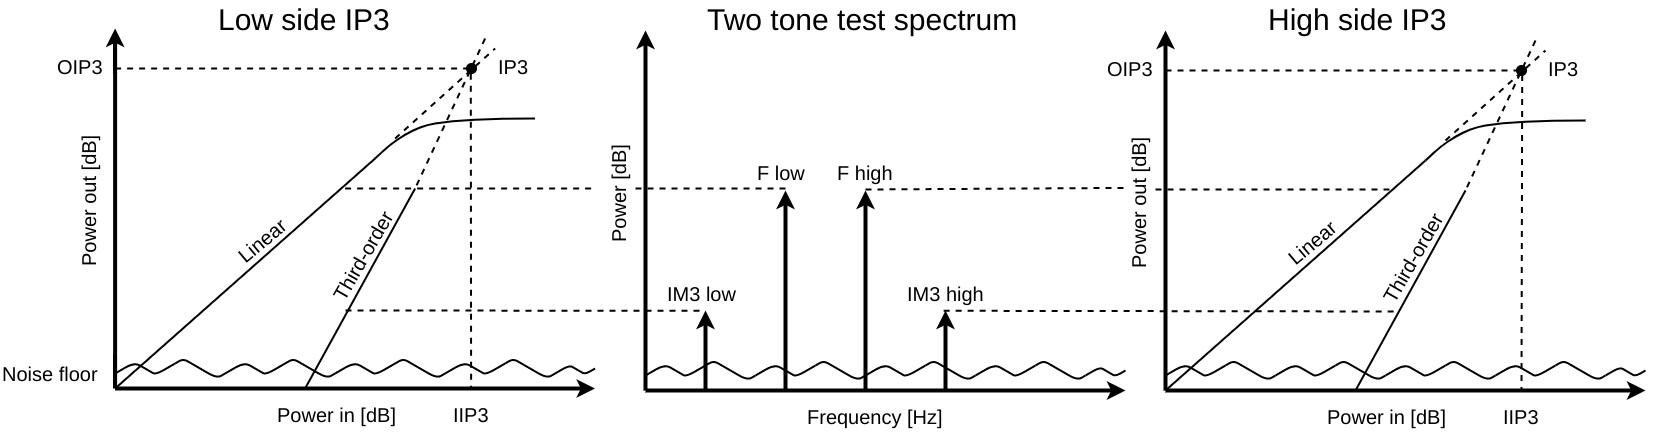
Relationship between two tone test and IP3 measurement
The two tone test is conducted by setting up two equally strong carriers with a given spacing. By setting up a two-tone test, intermodulation products will be generated in any non-linear device. We are interested in the third order intermodulation products, these can be found at F_high + F_spacing and F_low – F_spacing.
The measured level of these intermodulation products may be used to calculacte output referred IP3 (OIP3) and input referred IP3 (IIP3), as illustrated in the figure above.
The third order intercept point is located at the intersection between the linear line and the third order line. In the logarithmic domain this may be mathematically expressed as:
![]()
Solving for X gives output referred location of the third order intercept point
![]()
Where P_fundamental is the power of one of the fundamental tones and P_IM3 is the power of the resulting intermodulation. Since the power difference between the output and the input of a LNA is gain, the input referred third order intercept point is found by
![]()
There is no guarantee that the low and high intermodulation power is equal, so both low and high side powers must be recorded.
Two-tone measurement is performed with 100 kHz spacing generated from a R&S SMU 200A signal generator that is connected to the device under test. The resulting distortion is measured by a R&S FSQ 40 signal analyzer. Inherent test setup distortion is measured for all frequency ranges, but intermodulation products were buried in the noise floor for generator output power of -37 dBm per carrier.
For the SSB-Electronic devices the IP3 measurement for mid-level of potentiometer is done right after NF and gain measurement to ensure that these occur at the same level.
Saturation
In presence of a strong transmitter the LNA might saturate. If this happens it may be necessary to add filtering to attenuate the saturation source.
The measure of how much input power an amplifier can take before spurious emissions are generated is the Spurious Free Dynamic Range (DR_f). DR_f is given as the magnitude relation between the fundamental power and the third order intermodulation product.

If the goal is to measure signals that are at the noise floor, the signal that will induce detrimental spurious behaviour is located at DR_f dB over the noise floor.
It is important to note that DR_f is measured at a specific frequency spacing, and that DR_f is typically lower for close spacing. For HF amateur radio it is more common to use smaller spacing for two tone tests, this way interference from nearby stations during contests may be assessed. A common spacing is 2 kHz, where an adjacent station may be located during contests. The intention with these LNAs is to work weak signals. Local interference is more likely than interference from the intended mode of propagation so wide band blocking is
Finally the insertion loss of the LNAs with internal bypass relays are measured. This is measured by a R&S ZNB 8 Vector Network Analyser (VNA) . Calibration is done with a HP 85052B calibration kit.
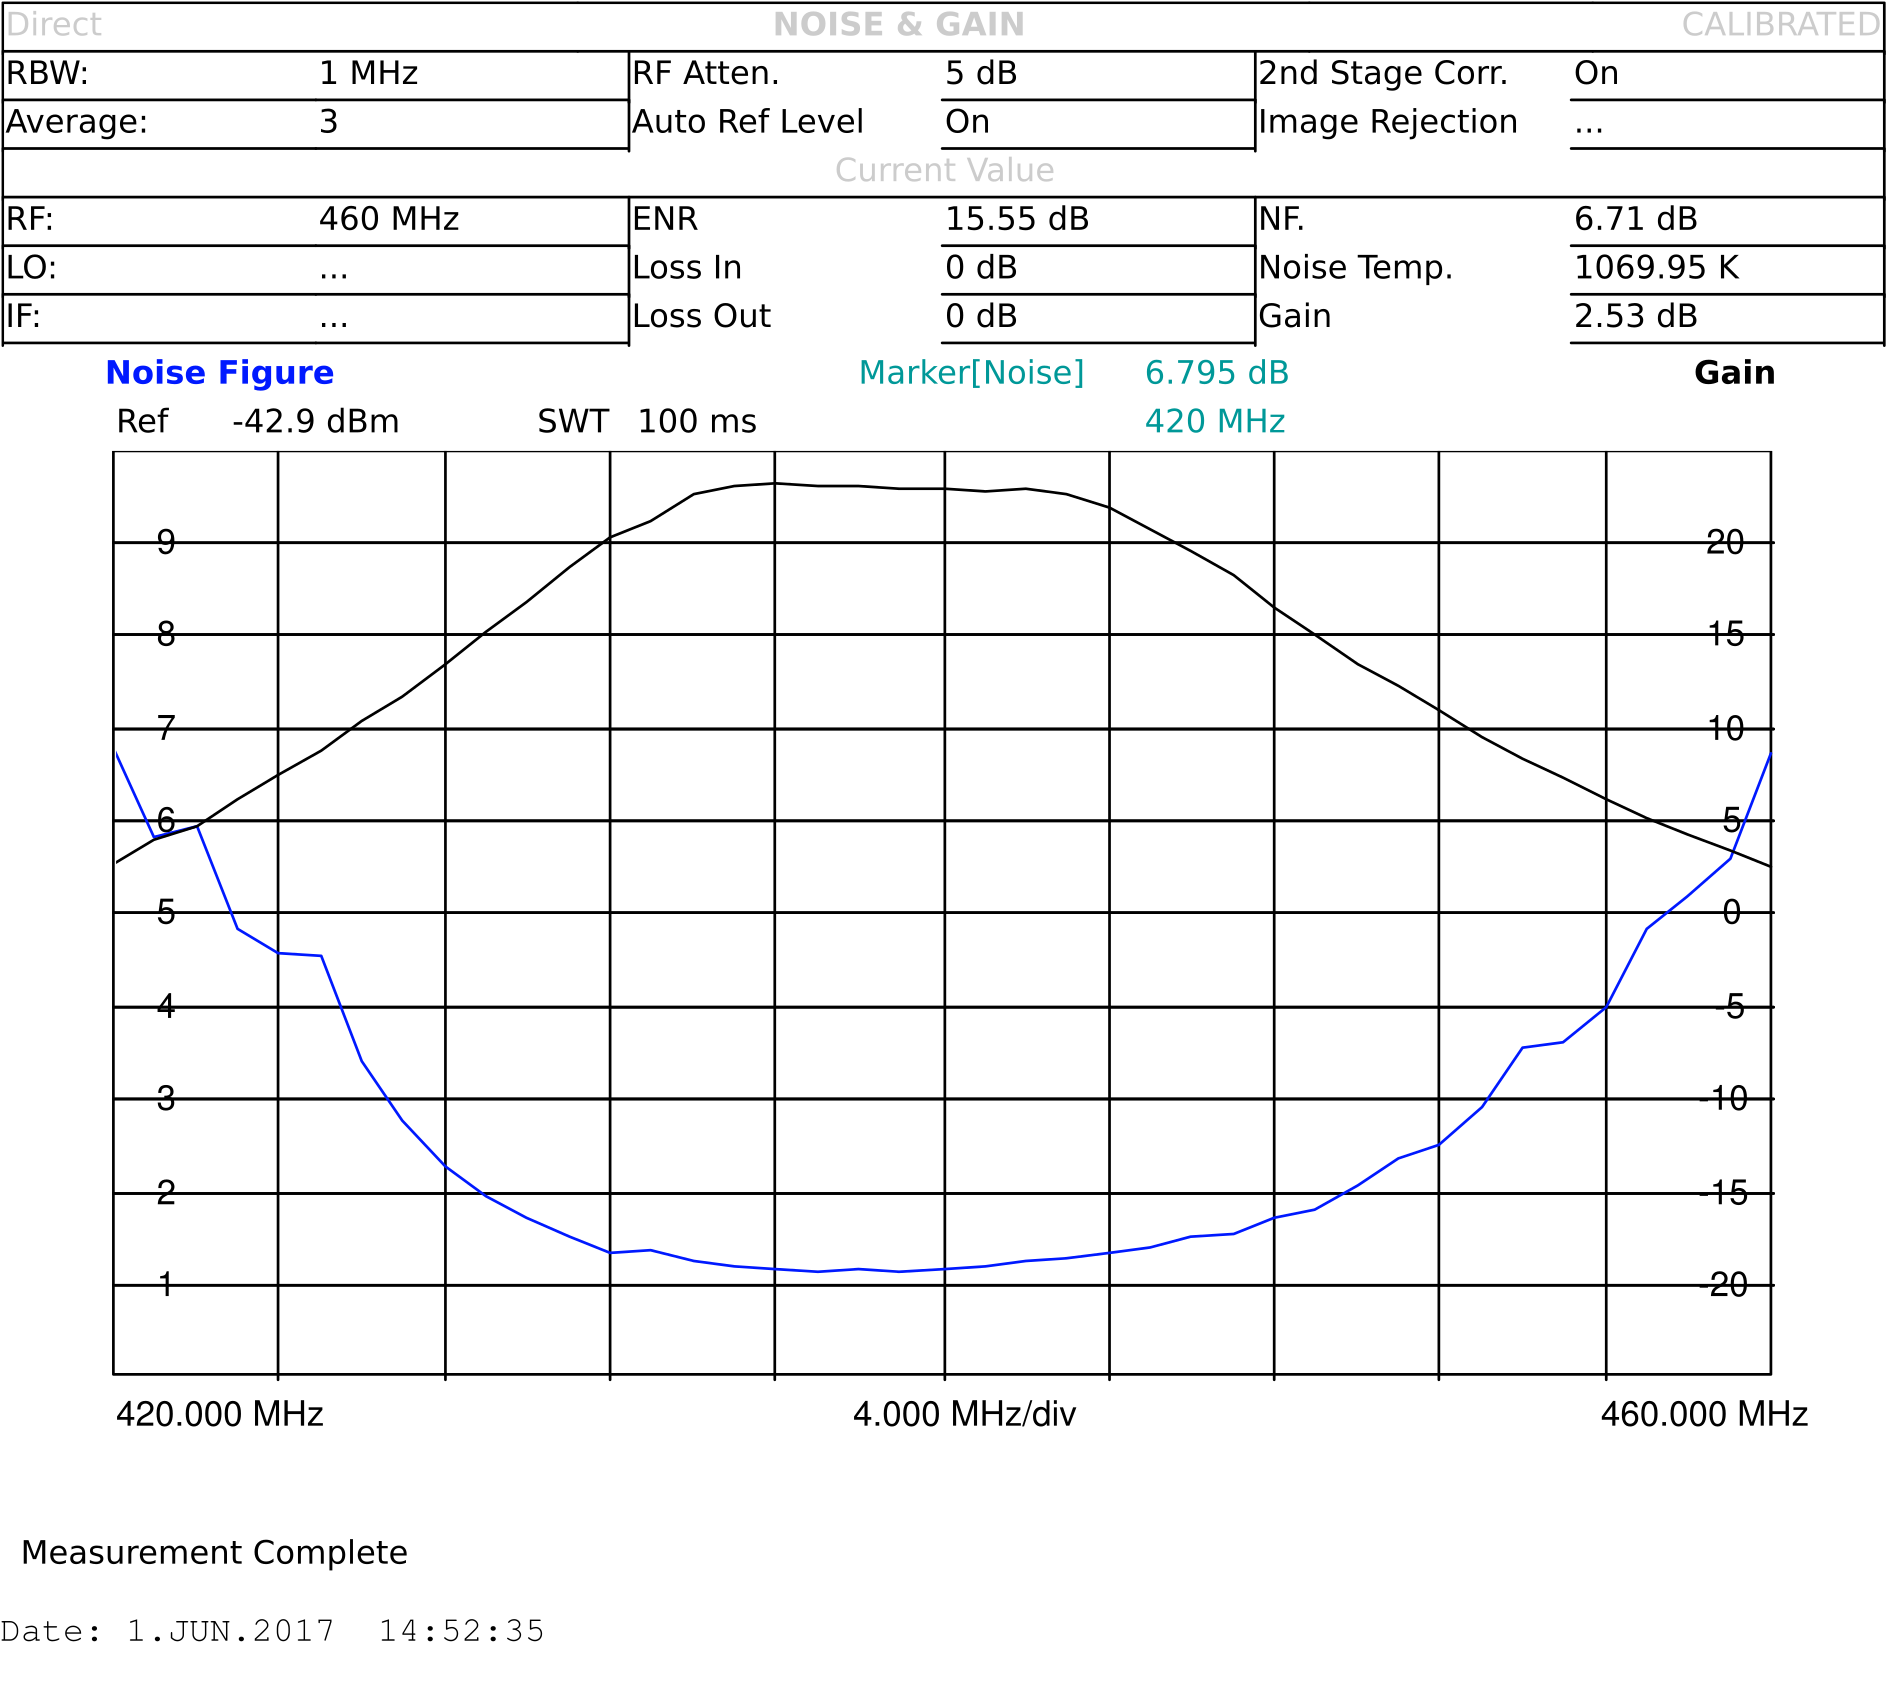
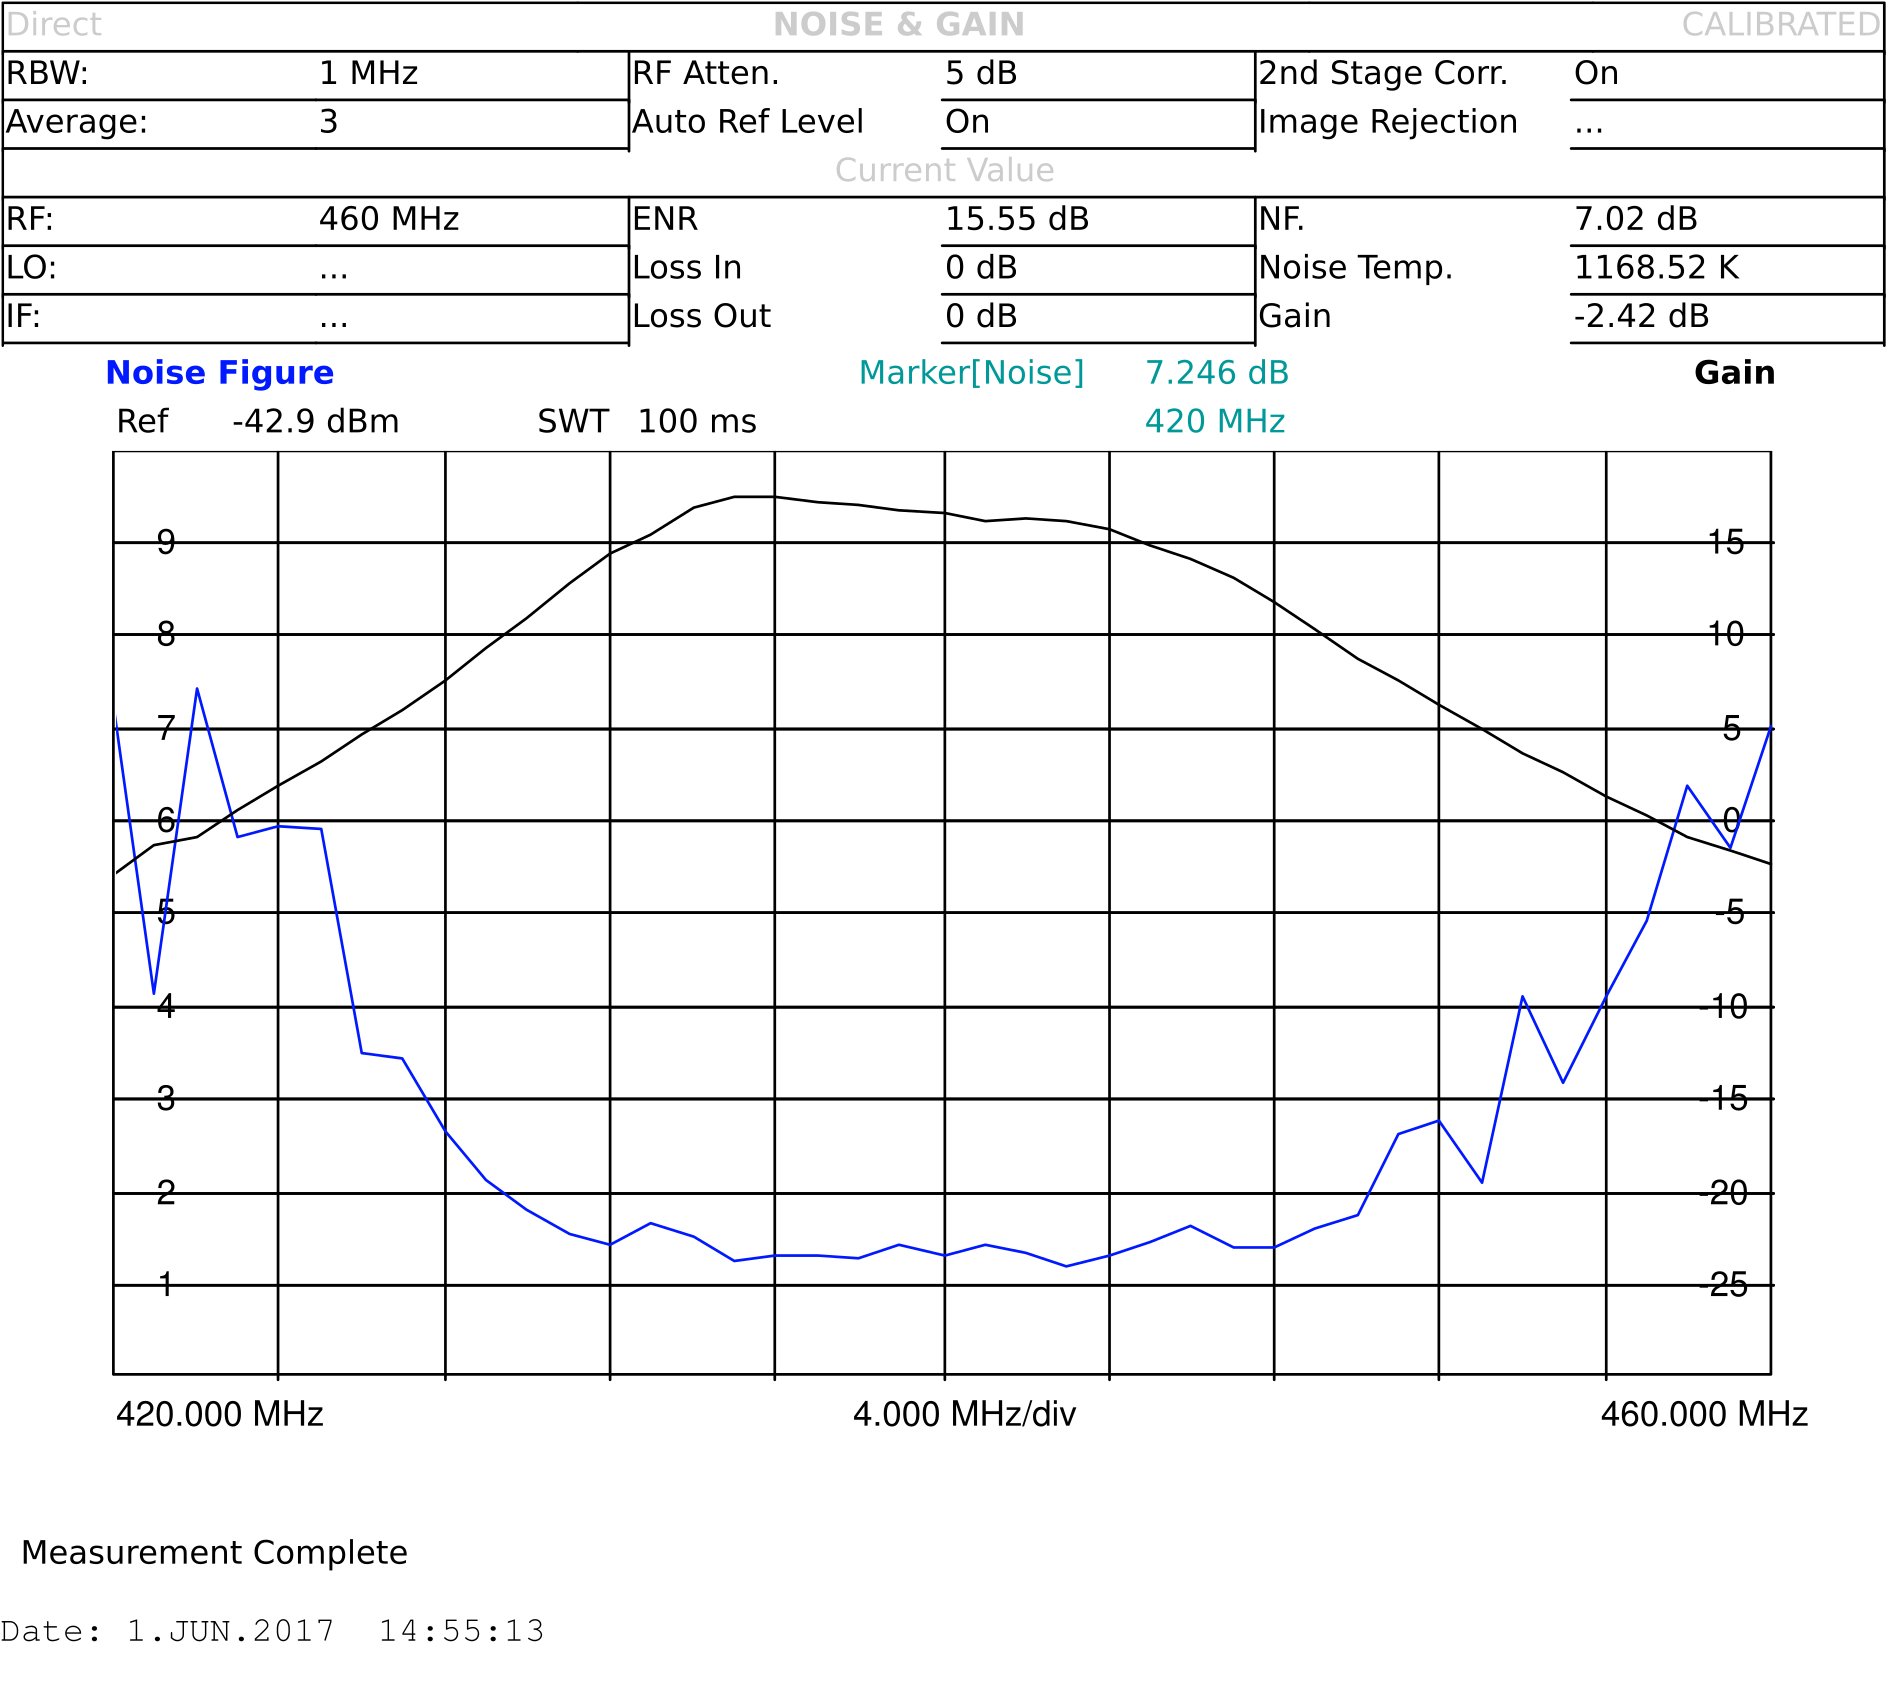
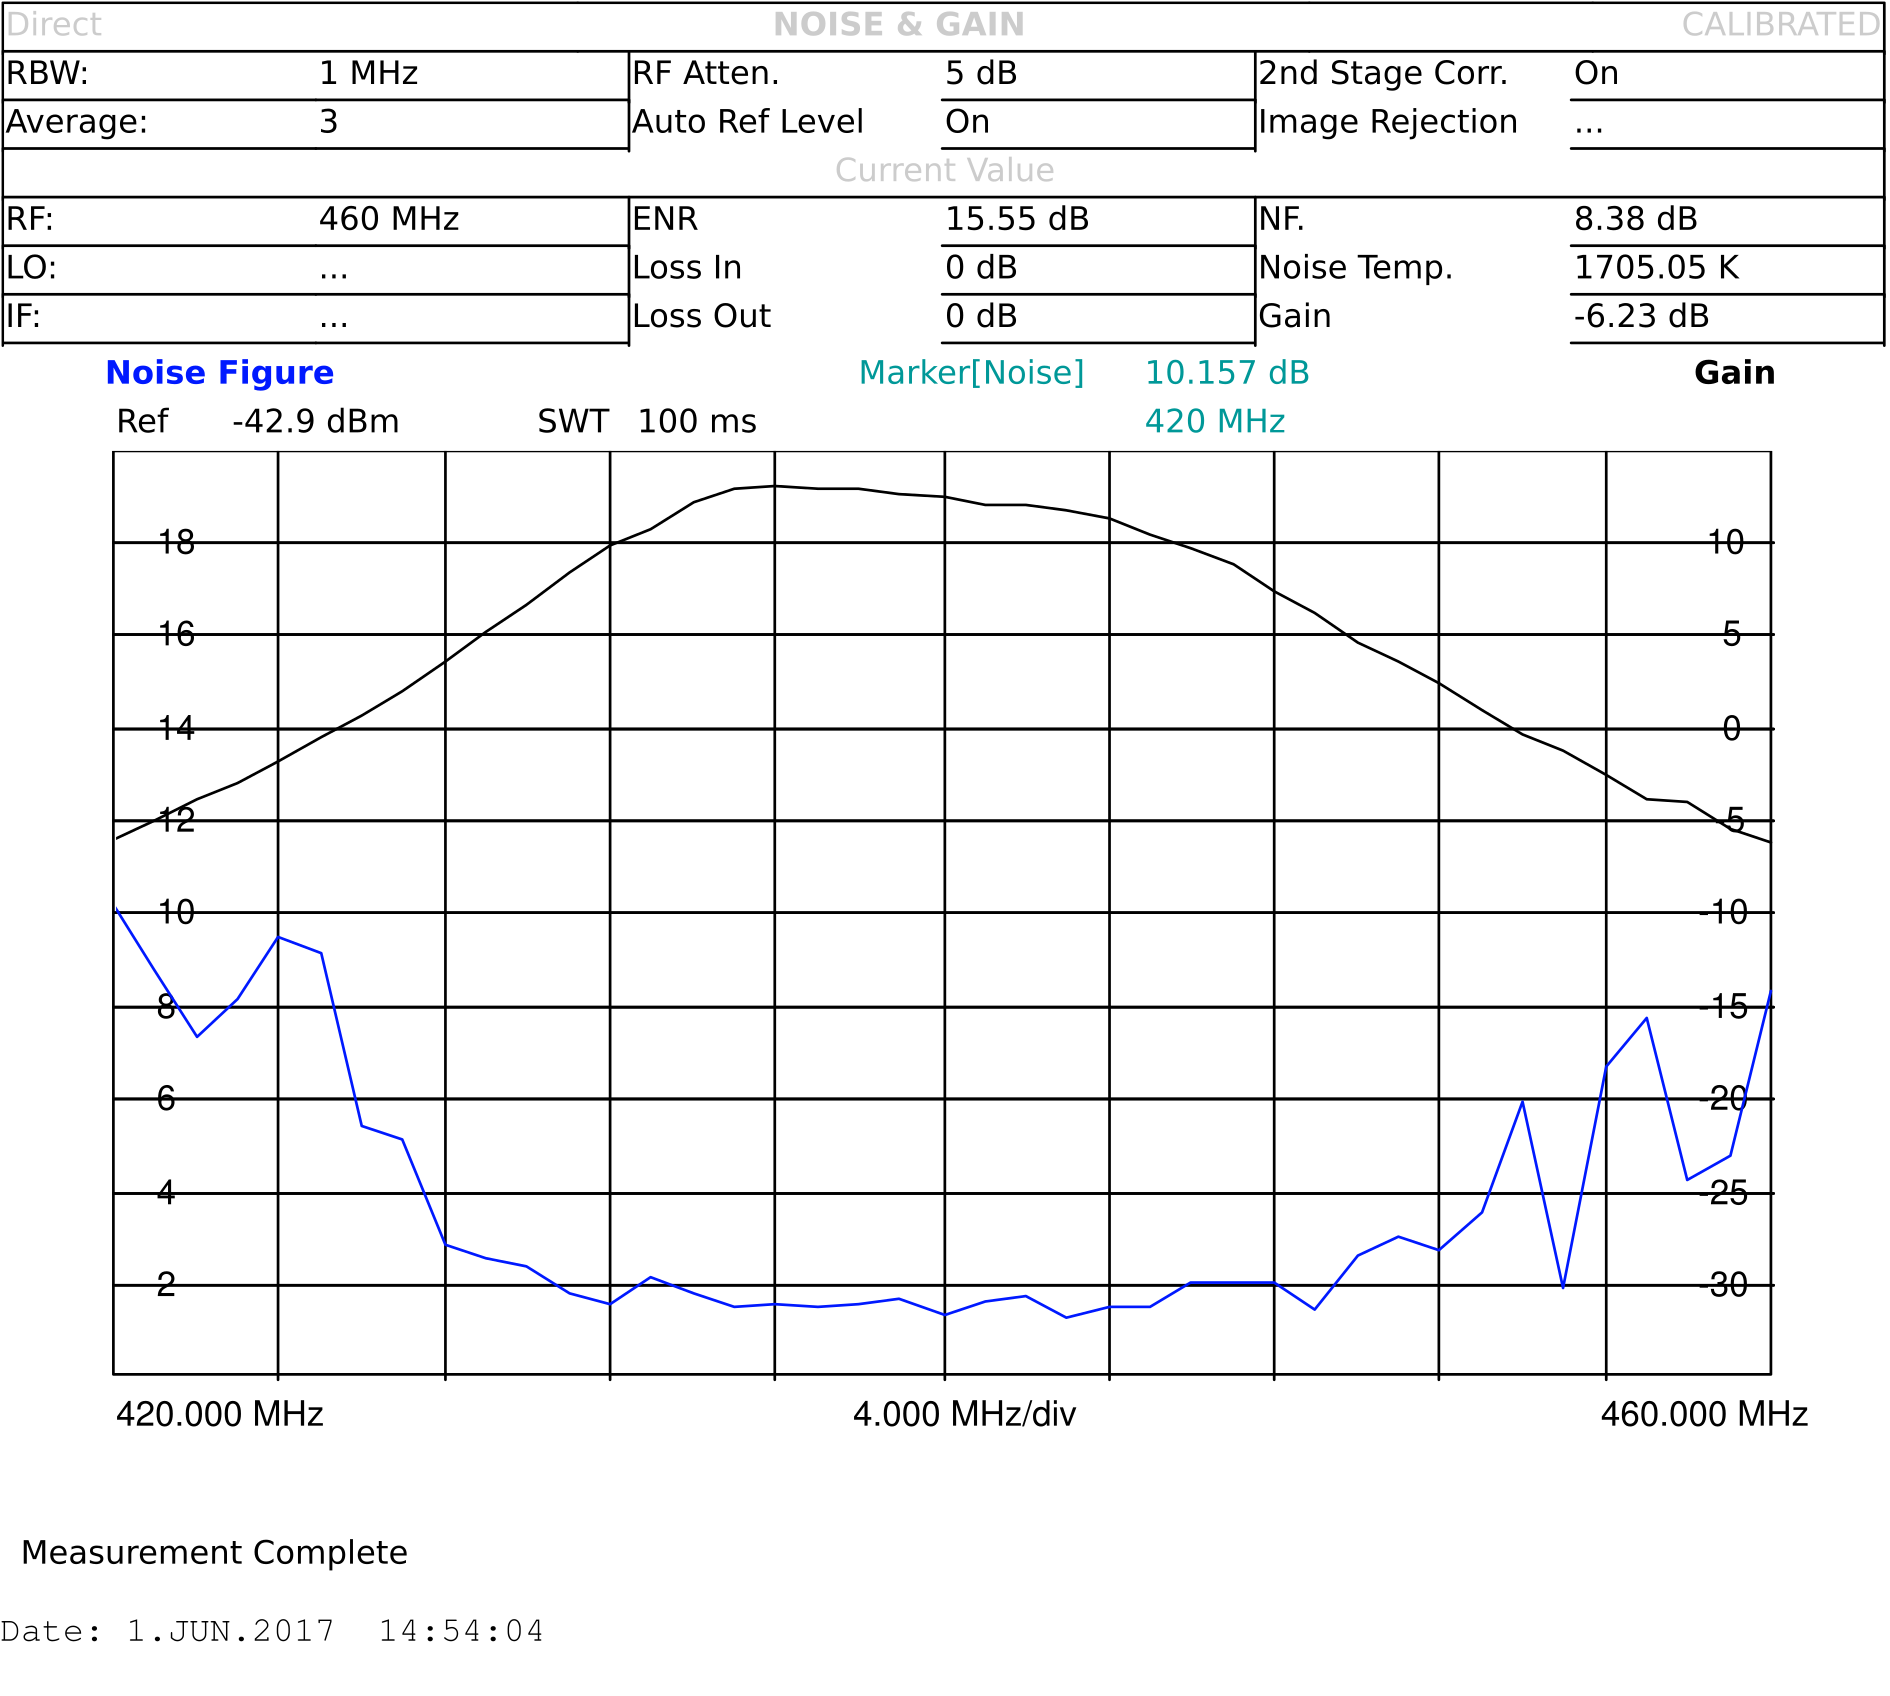
Results
In the following figures the gain of the devices is shown with a black trace with values in dB on the right hand axis. Similarly the noise figure is shown with a blue trace with values in dB on the left hand axis.
Click each text section to expand the results for the different LNAs.
SSB-Electronics SP-7000
SSB-Electronics SP-7000
SP7000 High gain setting
SP7000 High gain setting:
Gain: 22.6 dB
Noise figure: 1.252 dB
Low fundamental tone power (434.95 MHz): -21.22 dBm
High fundamental tone power (435.05 MHz): -22.6 dBm
Low IM3 power (434.85 MHz): – 96.8 dBm
High IM3 power (435.15 MHz): -98.9 dBm
Low side OIP3: 37.73 dBm
High side OIP3: 38.84 dBm
Low side IIP3: 16.24 dBm
High side IIP3: 15.13 dBm
Low side DR_f: 77.68 dB
High side DR_f: 75.46 dB
Insertion loss: 0.28 dB
SP7000 Medium gain setting
SP7000 Medium gain setting:Gain: 16.96 dB
Noise figure: 1.514 dB
Low fundamental tone power (434.95 MHz): -26.93 dBm
High fundamental tone power (435.05 MHz): -26.79 dBm
Low IM3 power (434.85 MHz): -102.2 dBm
High IM3 power (435.15 MHz): -104.3 dBm
Low side OIP3: 37.635 dBm
High side OIP3: 38.755 dBm
Low side IIP3: 20.675 dBm
High side IIP3: 21.795 dBm
Low side DR_f: 75.27 dB
High side DR_f: 77.51 dB
Insertion loss: 0.28 dB
SP7000 low gain setting
SP7000 Low gain setting:Gain: 12.23 dB
Noise figure: 1.841 dB
Low fundamental tone power (434.95 MHz) : -31.35 dBm
High fundamental tone power (435.05 MHz): -31.3 dBm
Low IM3 power (434.85 MHz): -106.8 dBm
High IM3 power (435.15 MHz): -109.1 dBm
Low side OIP3: 37.73 dBm
High side OIP3: 38.9 dBm
Low side IIP3: 25.5 dBm
High side IIP3: 26.67 dBm
Low side DR_f: 75.45 dB
High side DR_f: 77.8 dB
Insertion loss: 0.28 dB
SSB-Electronics SP-70
SSB-Electronics SP-7000

SP70 high gain setting
SP70 High gain setting:
Gain: 22.13 dB
Noise figure: 0.68 dB
Low fundamental tone power (434.95 MHz): -21.64 dBm
High fundamental tone power (435.05 MHz): -21.6 dBm
Low IM3 power (434.85 MHz): – 95.6 dBm
High IM3 power (435.15 MHz): -99.4 dBm
Low side OIP3: 36.98 dB
High side OIP3: 38.9 dB
Low side IIP3: 14.85 dB
High side IIP3: 16.77 dB
Low side DR_f: 73.96 dB
High side DR_f: 77.8 dB
Insertion loss: 0.17 dB
SP70 medium gain setting
SP70 Medium gain setting:
Gain: 19.26 dB
Noise figure: 0.78 dB
Low fundamental tone power (434.95 MHz): -24.1 dBm
High fundamental tone power (435.05 MHz): -24.04 dBm
Low IM3 power (434.85 MHz): -98.2 dBm
High IM3 power (435.15 MHz): -102.1 dBm
Low side OIP3: 37.05 dBm
High side OIP3: 39.03 dBm
Low side IIP3: 17.46 dBm
High side IIP3: 19.44 dBm
Low side DR_f: 74.1 dB
High side DR_f: 78.06 dB
Insertion loss: 0.17 dB
SP70 low gain setting
SP70 Low gain setting:
Gain: 12.72 dB
Noise figure: 1.22 dB
Low fundamental tone power (434.95 MHz) : -31 dBm
High fundamental tone power (435.05 MHz): -30.95 dBm
Low IM3 power (434.85 MHz): -105.3 dBm
High IM3 power (435.15 MHz): -108.5 dBm
Low side OIP3: 37.15 dBm
High side OIP3: 38.78 dBm
Low side IIP3: 24.43 dBm
High side IIP3: 26.06 dBm
Low side DR_f: 74.3 dB
High side DR_f: 77.6 dB
Insertion loss: 0.17 dB
SSB-Electronics SP-2000
SSB-Electronics SP-2000
SP2000 high gain setting
SP2000 High gain setting:
Gain: 23.08 dB
Noise figure: 1.9 dB
Low fundamental tone power (144.95 MHz) : -20.95 dBm
High fundamental tone power (145.05 MHz): -20.79 dBm
Low IM3 power (144.85 MHz): -84.5 dBm
High IM3 power (145.15 MHz): -87.8 dBm
Low side OIP3: 31.78 dB
High side OIP3: 33.51 dB
Low side IIP3: 17.86 dB
High side IIP3: 19.60 dB
Low side DR_f: 63.55 dB
High side DR_f: 67.01 dB
Insertion loss: 0.09 dB
SP2000 medium gain setting
SP2000 Medium gain setting:
Gain: 18.58 dB
Noise figure: 1.92 dB
Low fundamental tone power (144.95 MHz) : -25.23 dBm
High fundamental tone power (145.05 MHz): -25.07 dBm
Low IM3 power (144.85 MHz): -89.1 dBm
High IM3 power (145.15 MHz): -92.5 dBm
Low side OIP3: 31.94 dB
High side OIP3: 33.72 dB
Low side IIP3: 8.86 dB
High side IIP3: 10.64 dB
Low side DR_f: 63.87 dB
High side DR_f: 67.43 dB
Insertion loss: 0.09 dB
SP2000 low gain setting
SP2000 Low gain setting:
Gain: 13.91 dB
Noise figure: 2.03 dB
Low fundamental tone power (144.95 MHz) : -29.95 dBm
High fundamental tone power (145.05 MHz): -29.78 dBm
Low IM3 power (144.85 MHz): -93.8 dBm
High IM3 power (145.15 MHz): -96.6 dBm
Low side OIP3: 31.93 dB
High side OIP3: 33.41 dB
Low side IIP3: 13.34 dB
High side IIP3: 14.83 dB
Low side DR_f: 63.85 dB
High side DR_f: 66.82 dB
Insertion loss: 0.09 dB
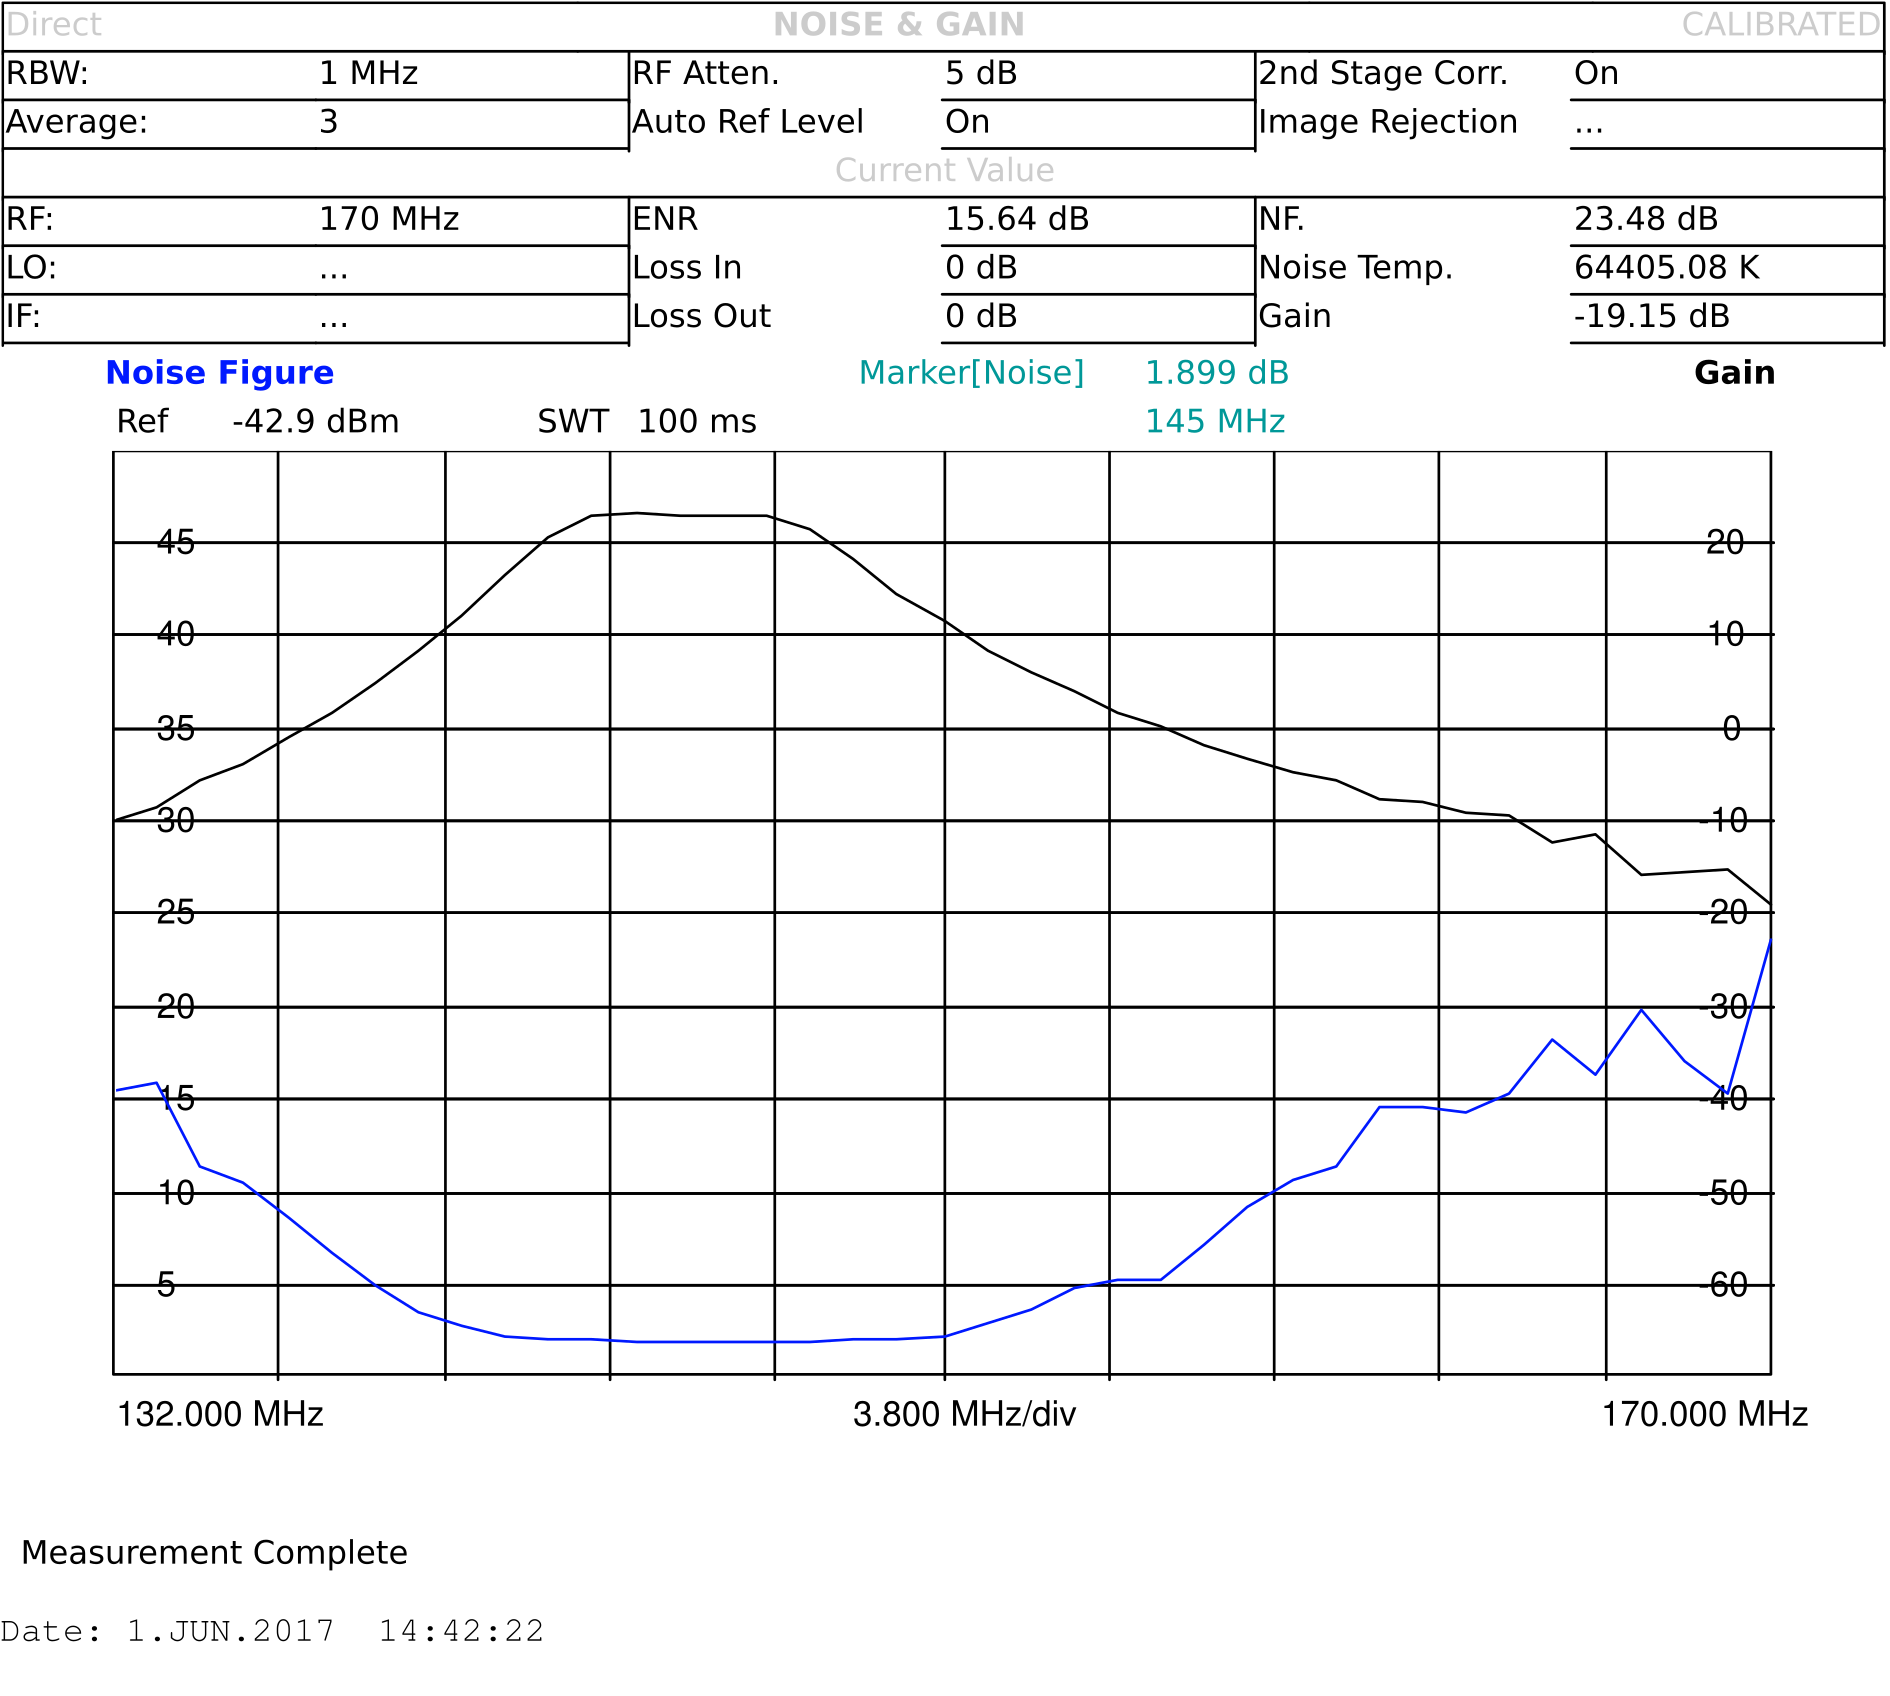
SSB-Electronics SP-200
SSB-Electronics SP-200
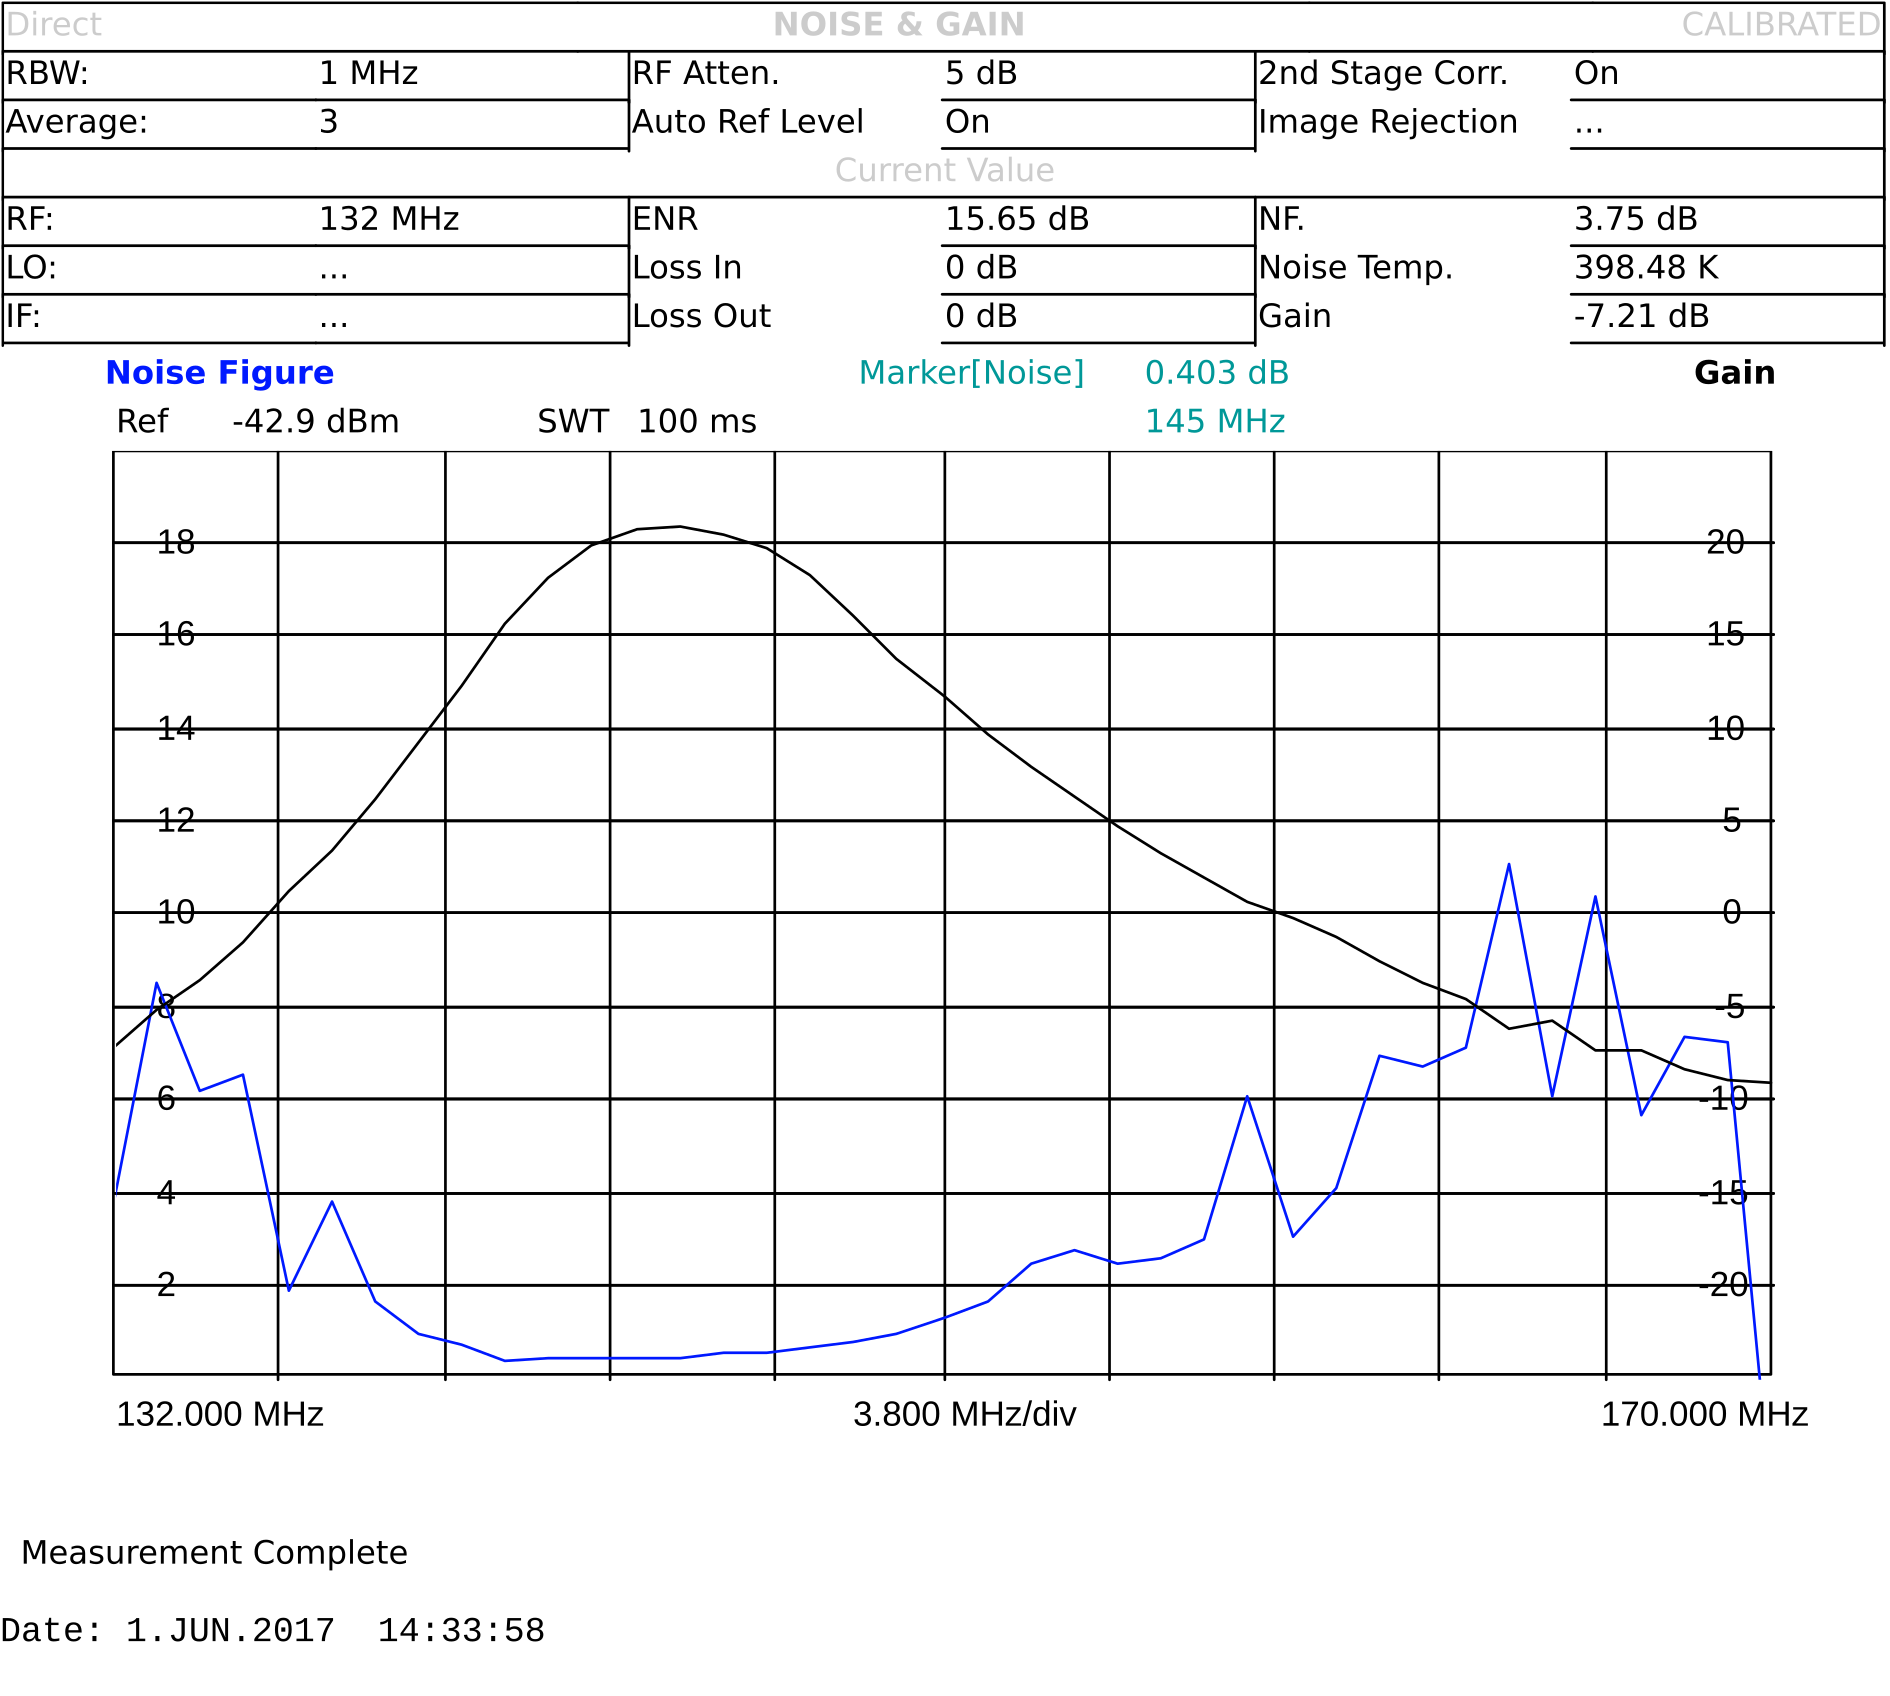
SP200 high gain setting
SP 200 High gain setting:
Gain: 20.5 dB
Noise figure: 0.4 dB
Low fundamental tone power (144.95 MHz) : -22.79 dBm
High fundamental tone power (145.05 MHz): -22.64 dBm
Low IM3 power (144.85 MHz): -95.5 dBm
High IM3 power (145.15 MHz): -95.6 dBm
Low side OIP3: 36.36 dB
High side OIP3: 36.48 dB
Low side IIP3: 23.63 dB
High side IIP3: 23.75 dB
Low side DR_f: 72.71 dB
High side DR_f: 72.96 dB
Insertion loss: 0.06 dB
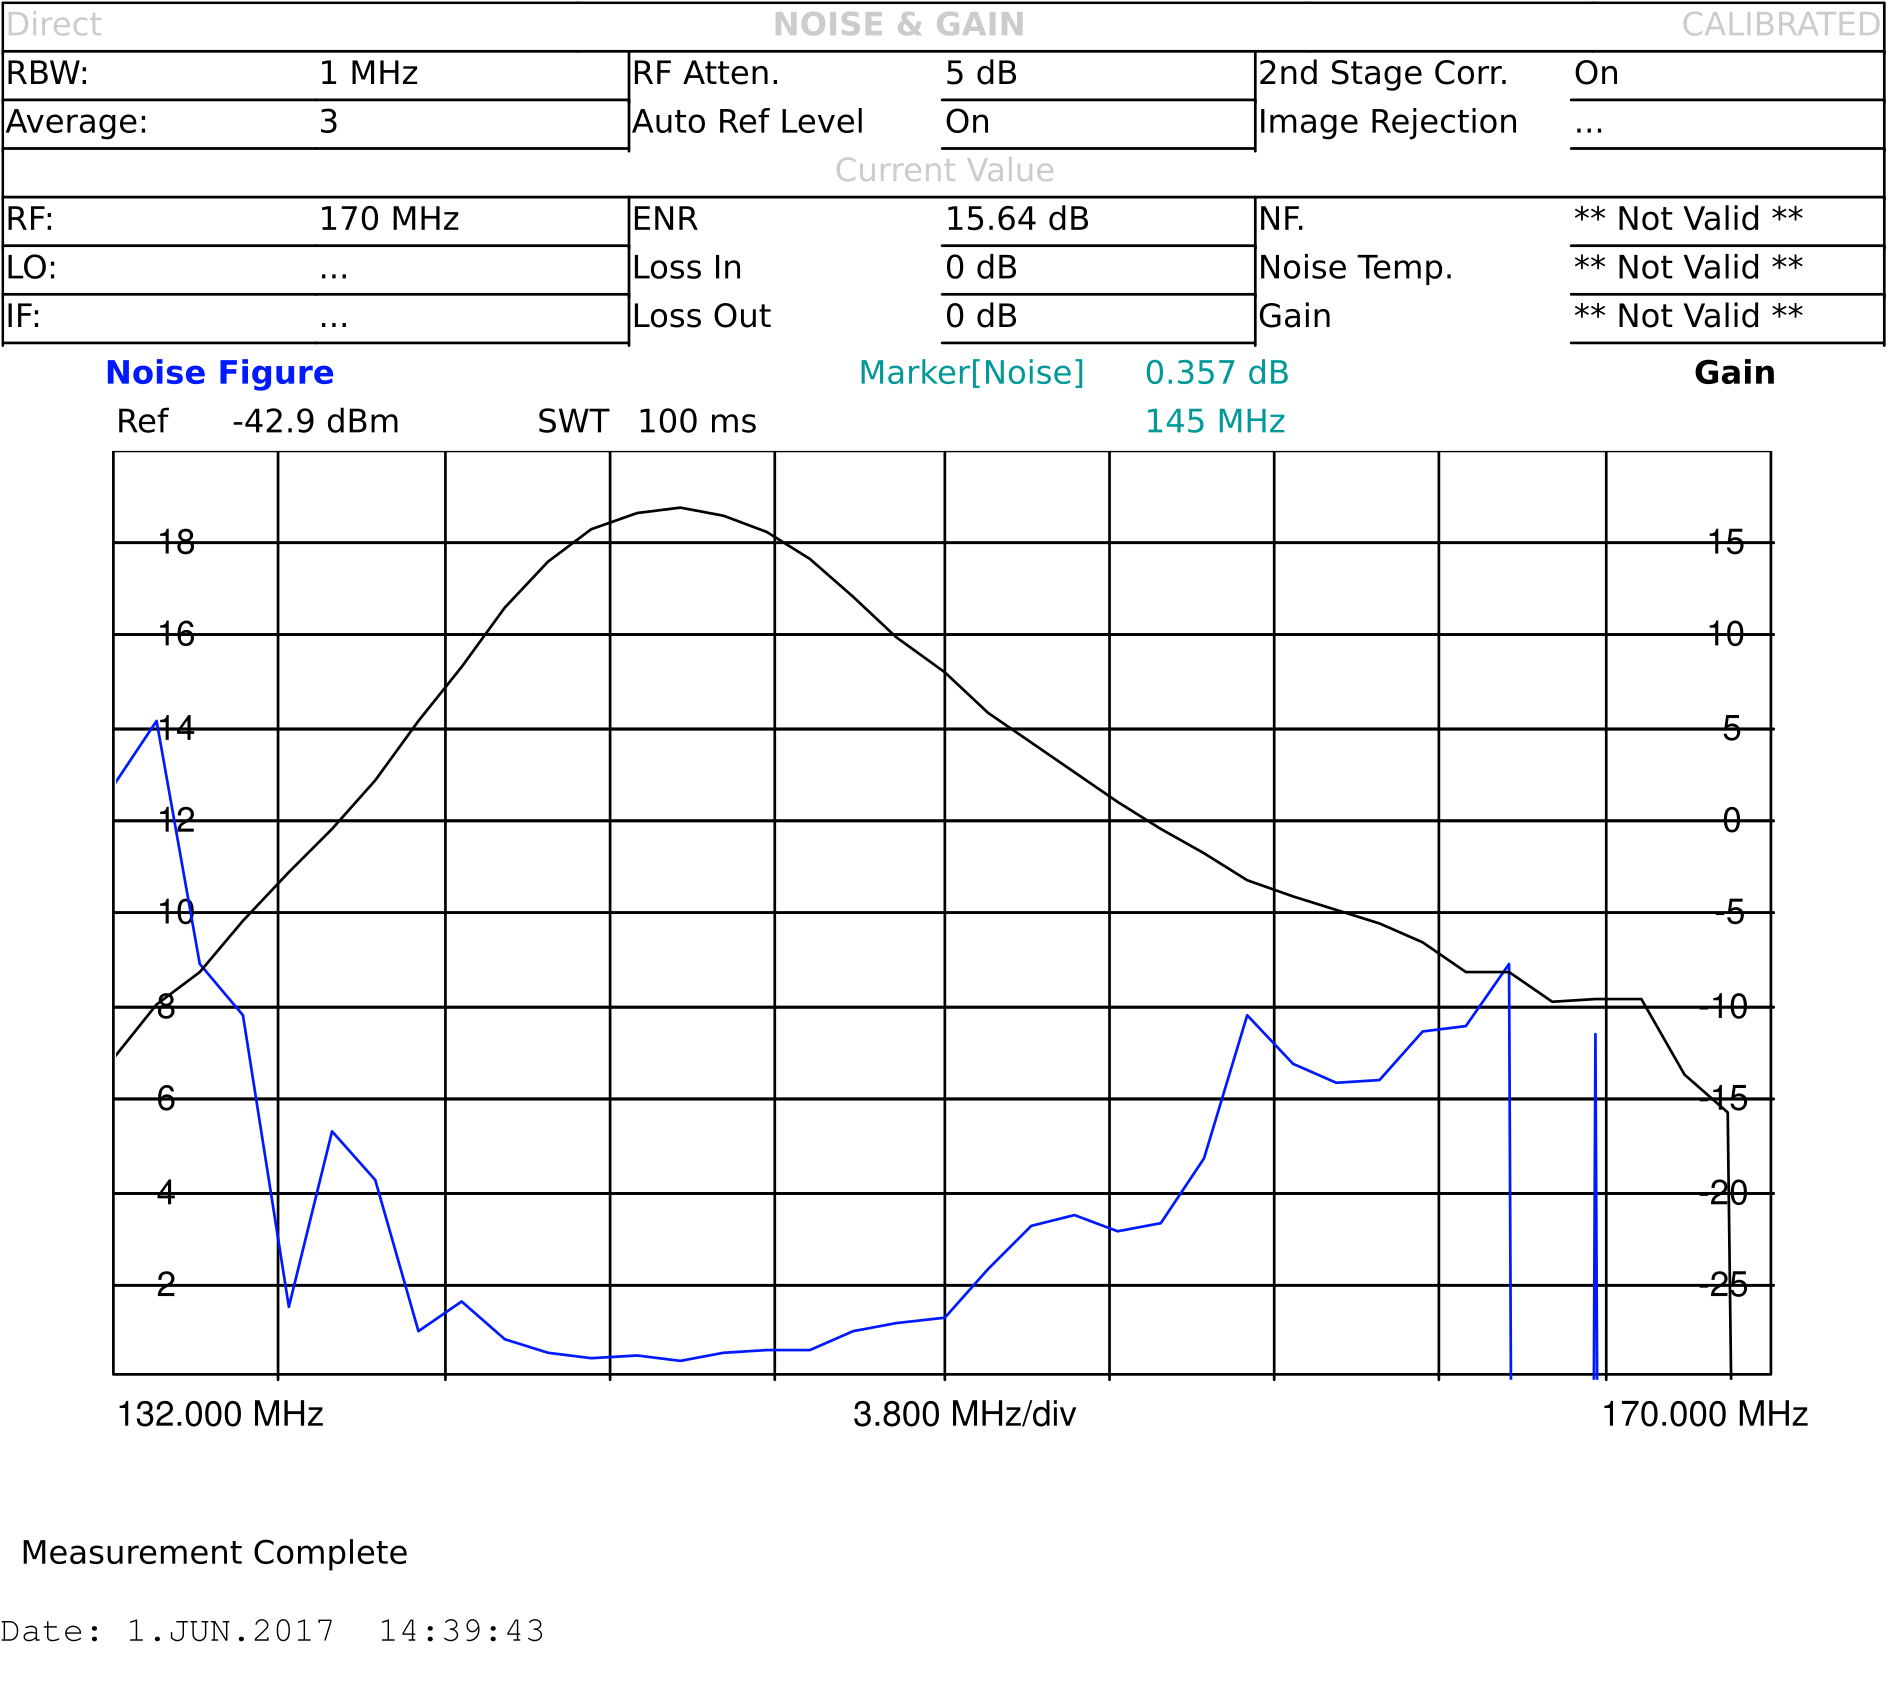
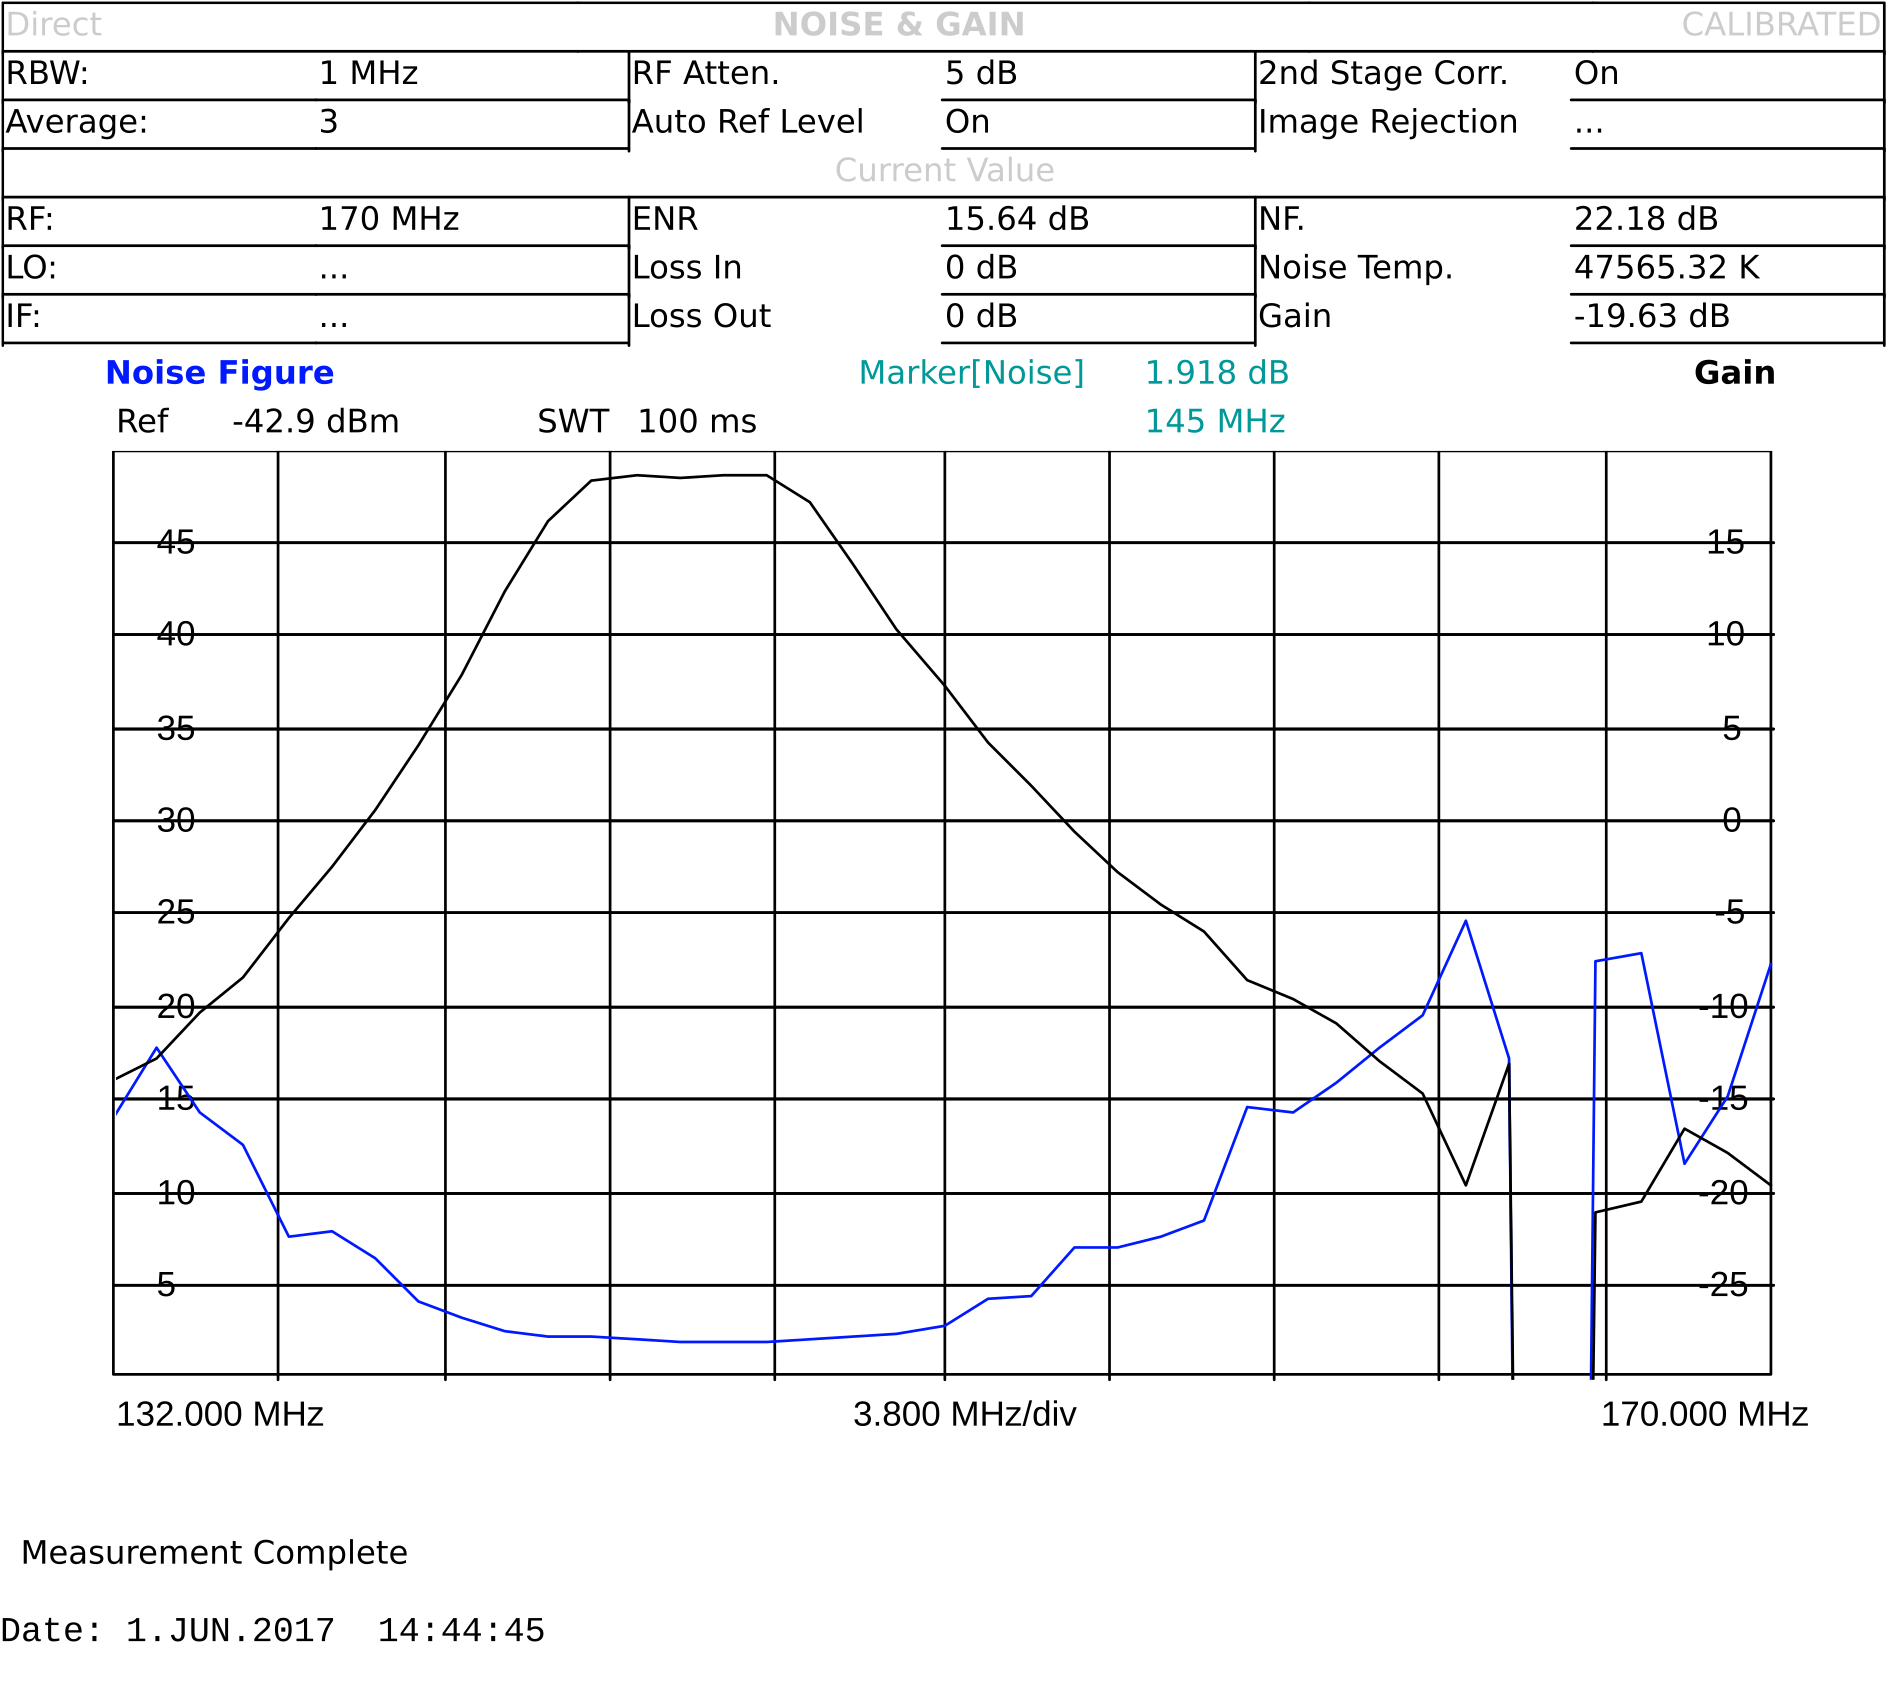
SP200 medium gain setting
SP 200 Medium gain setting:
Gain: 16.88 dB
Noise figure: 0.36 dB
Low fundamental tone power (144.95 MHz) : -26.67 dBm
High fundamental tone power (145.05 MHz): -26.53 dBm
Low IM3 power (144.85 MHz): -98.6 dBm
High IM3 power (145.15 MHz): -98.4 dBm
Low side OIP3: 35.97 dB
High side OIP3: 35.94 dB
Low side IIP3: 15.47 dB
High side IIP3: 15.44 dB
Low side DR_f: 71.83 dB
High side DR_f: 71.87 dB
Insertion loss: 0.06 dB
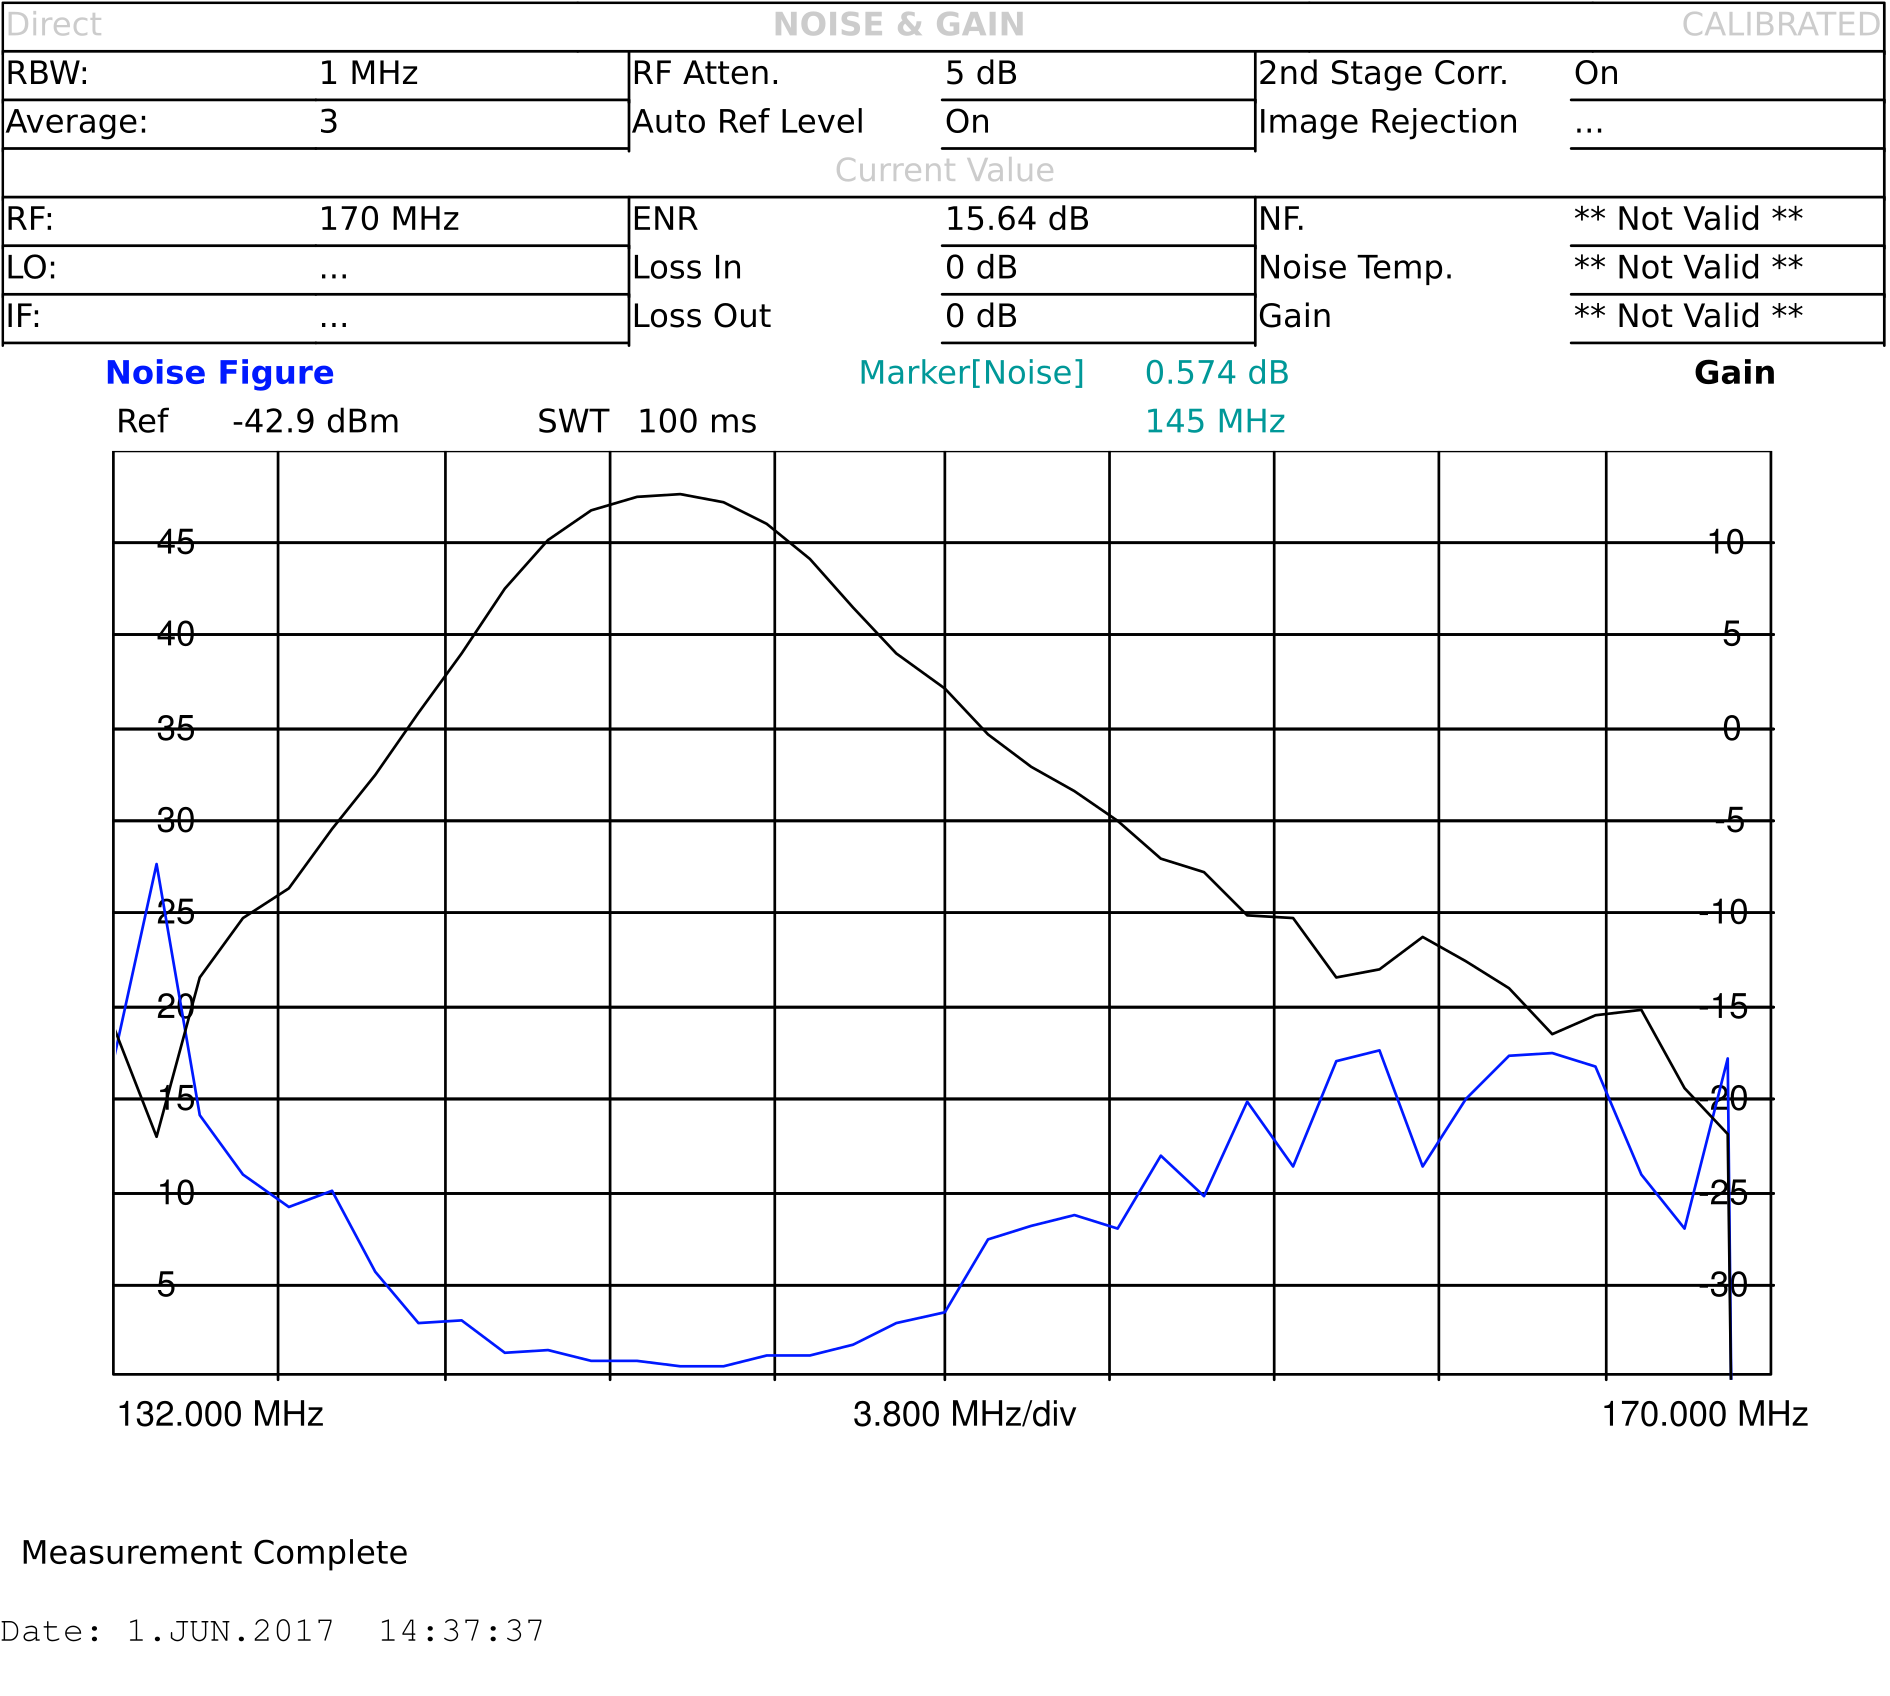
SP200 low gain setting
SP200 Low gain setting:
Gain: 12.73 dB
Noise figure: 0.57 dB
Low fundamental tone power (144.95 MHz) : -30.91 dBm
High fundamental tone power (145.05 MHz): -30.75 dBm
Low IM3 power (144.85 MHz): -102.6 dBm
High IM3 power (145.15 MHz): -102.2 dBm
Low side OIP3: 35.85 dB
High side OIP3: 35.73 dB
Low side IIP3: 18.97 dB
High side IIP3: 18.85 dB
Low side DR_f: 71.69 dB
High side DR_f: 71.45 dB
Insertion loss: 0.06 dB
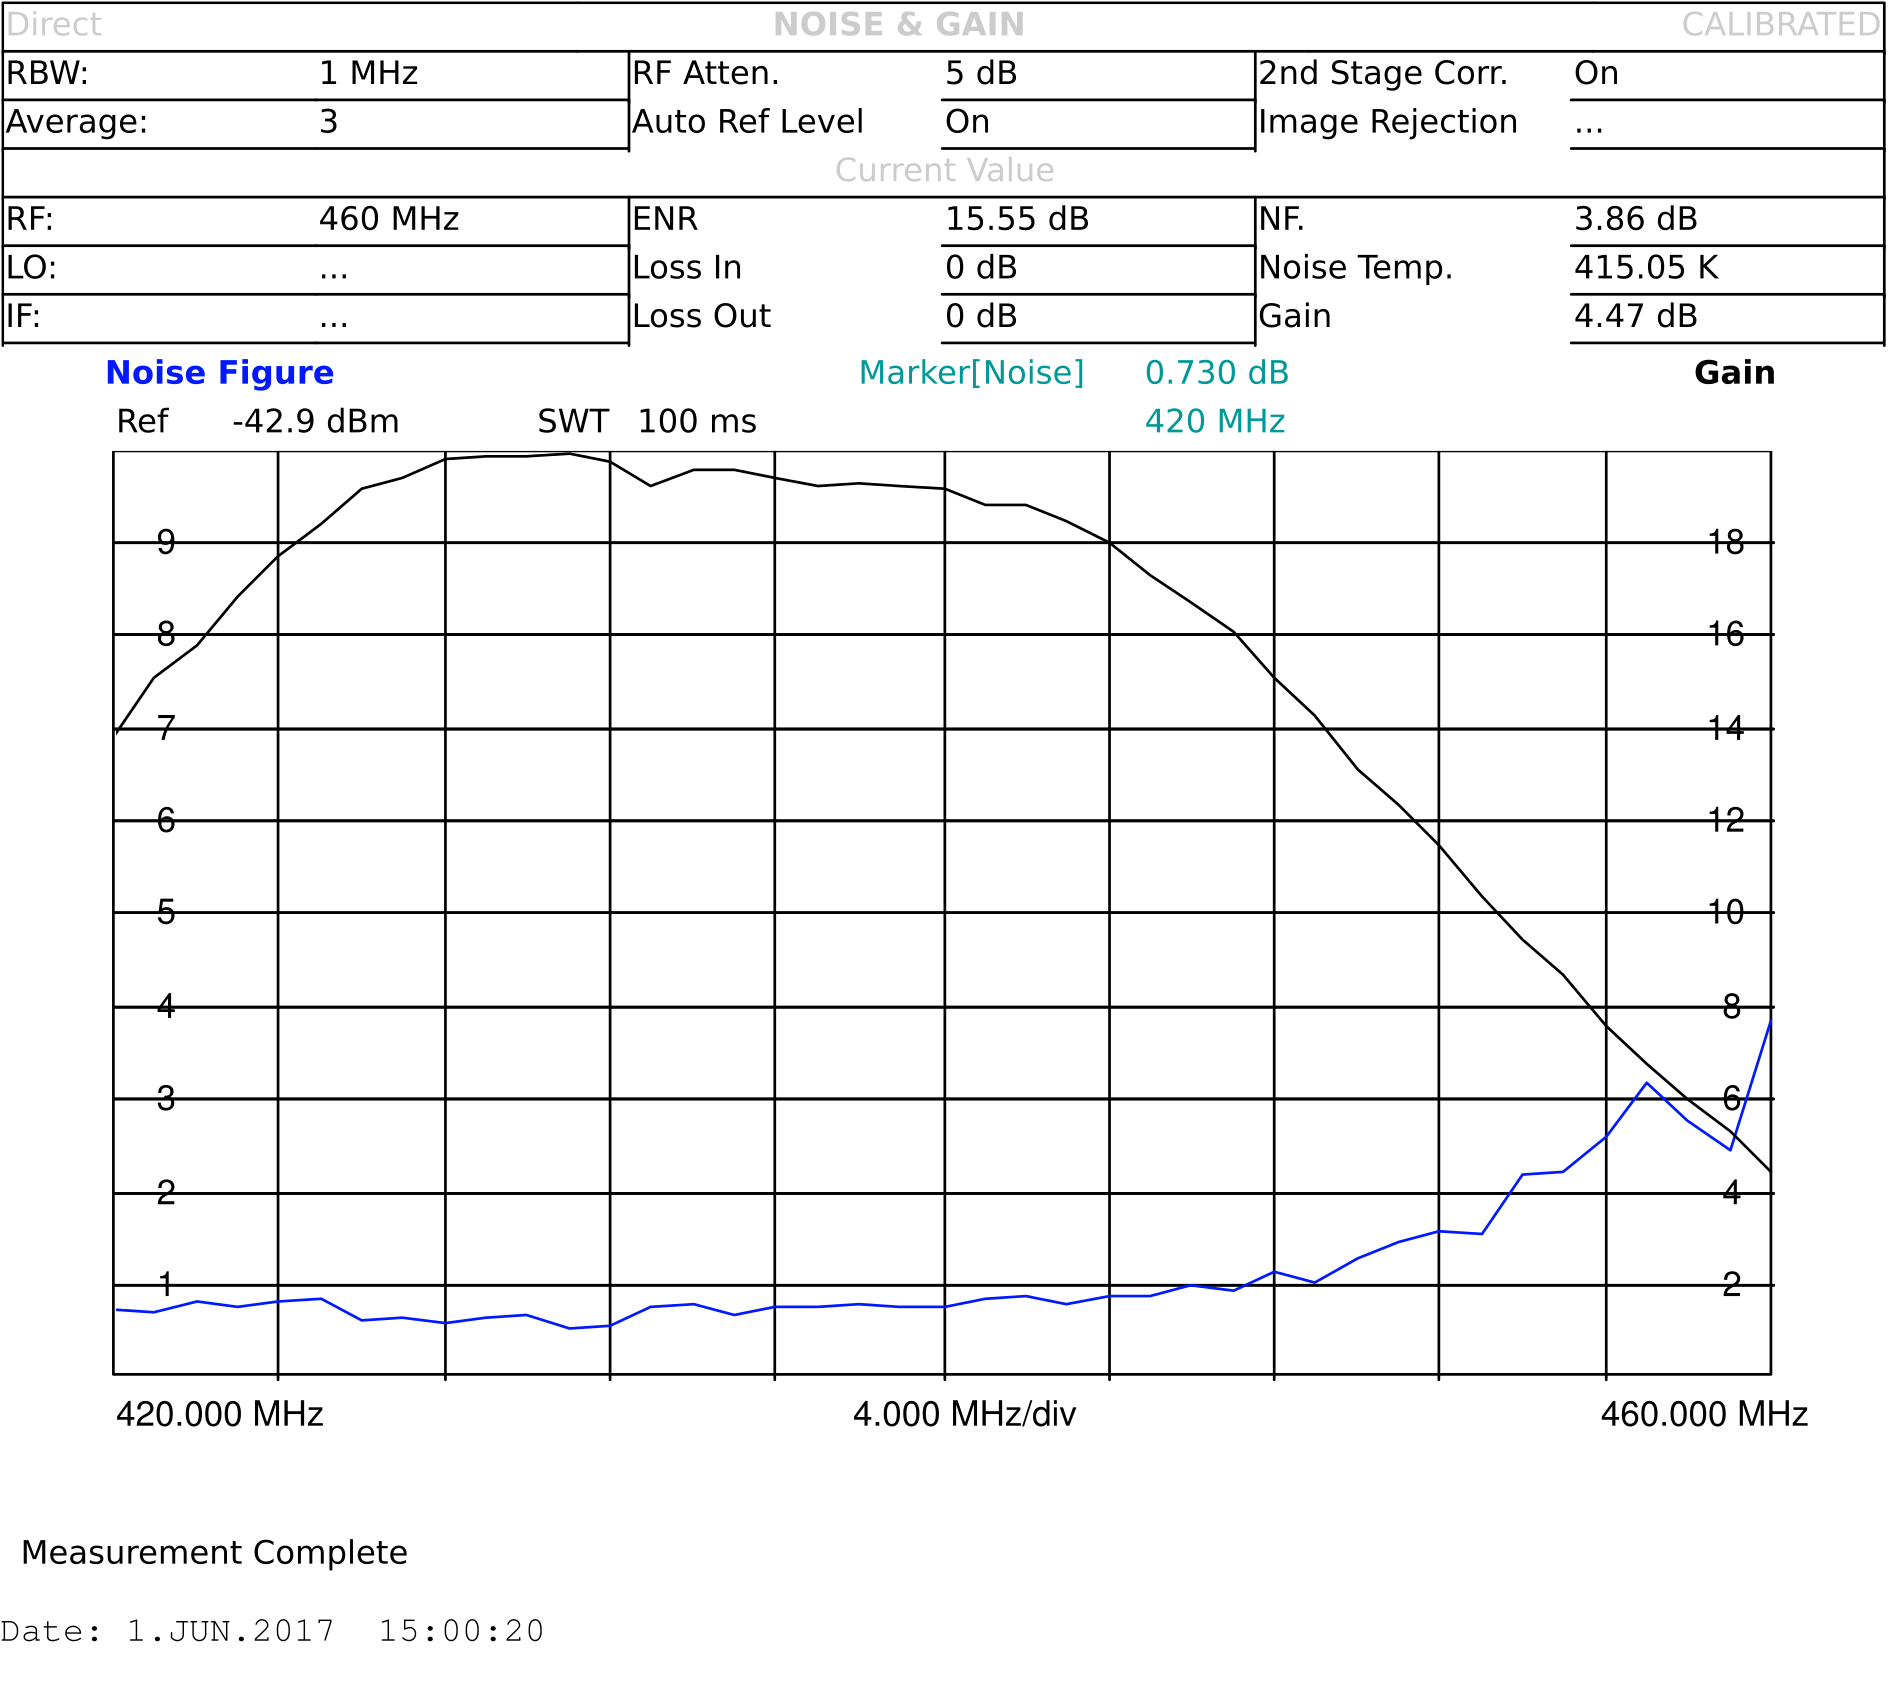
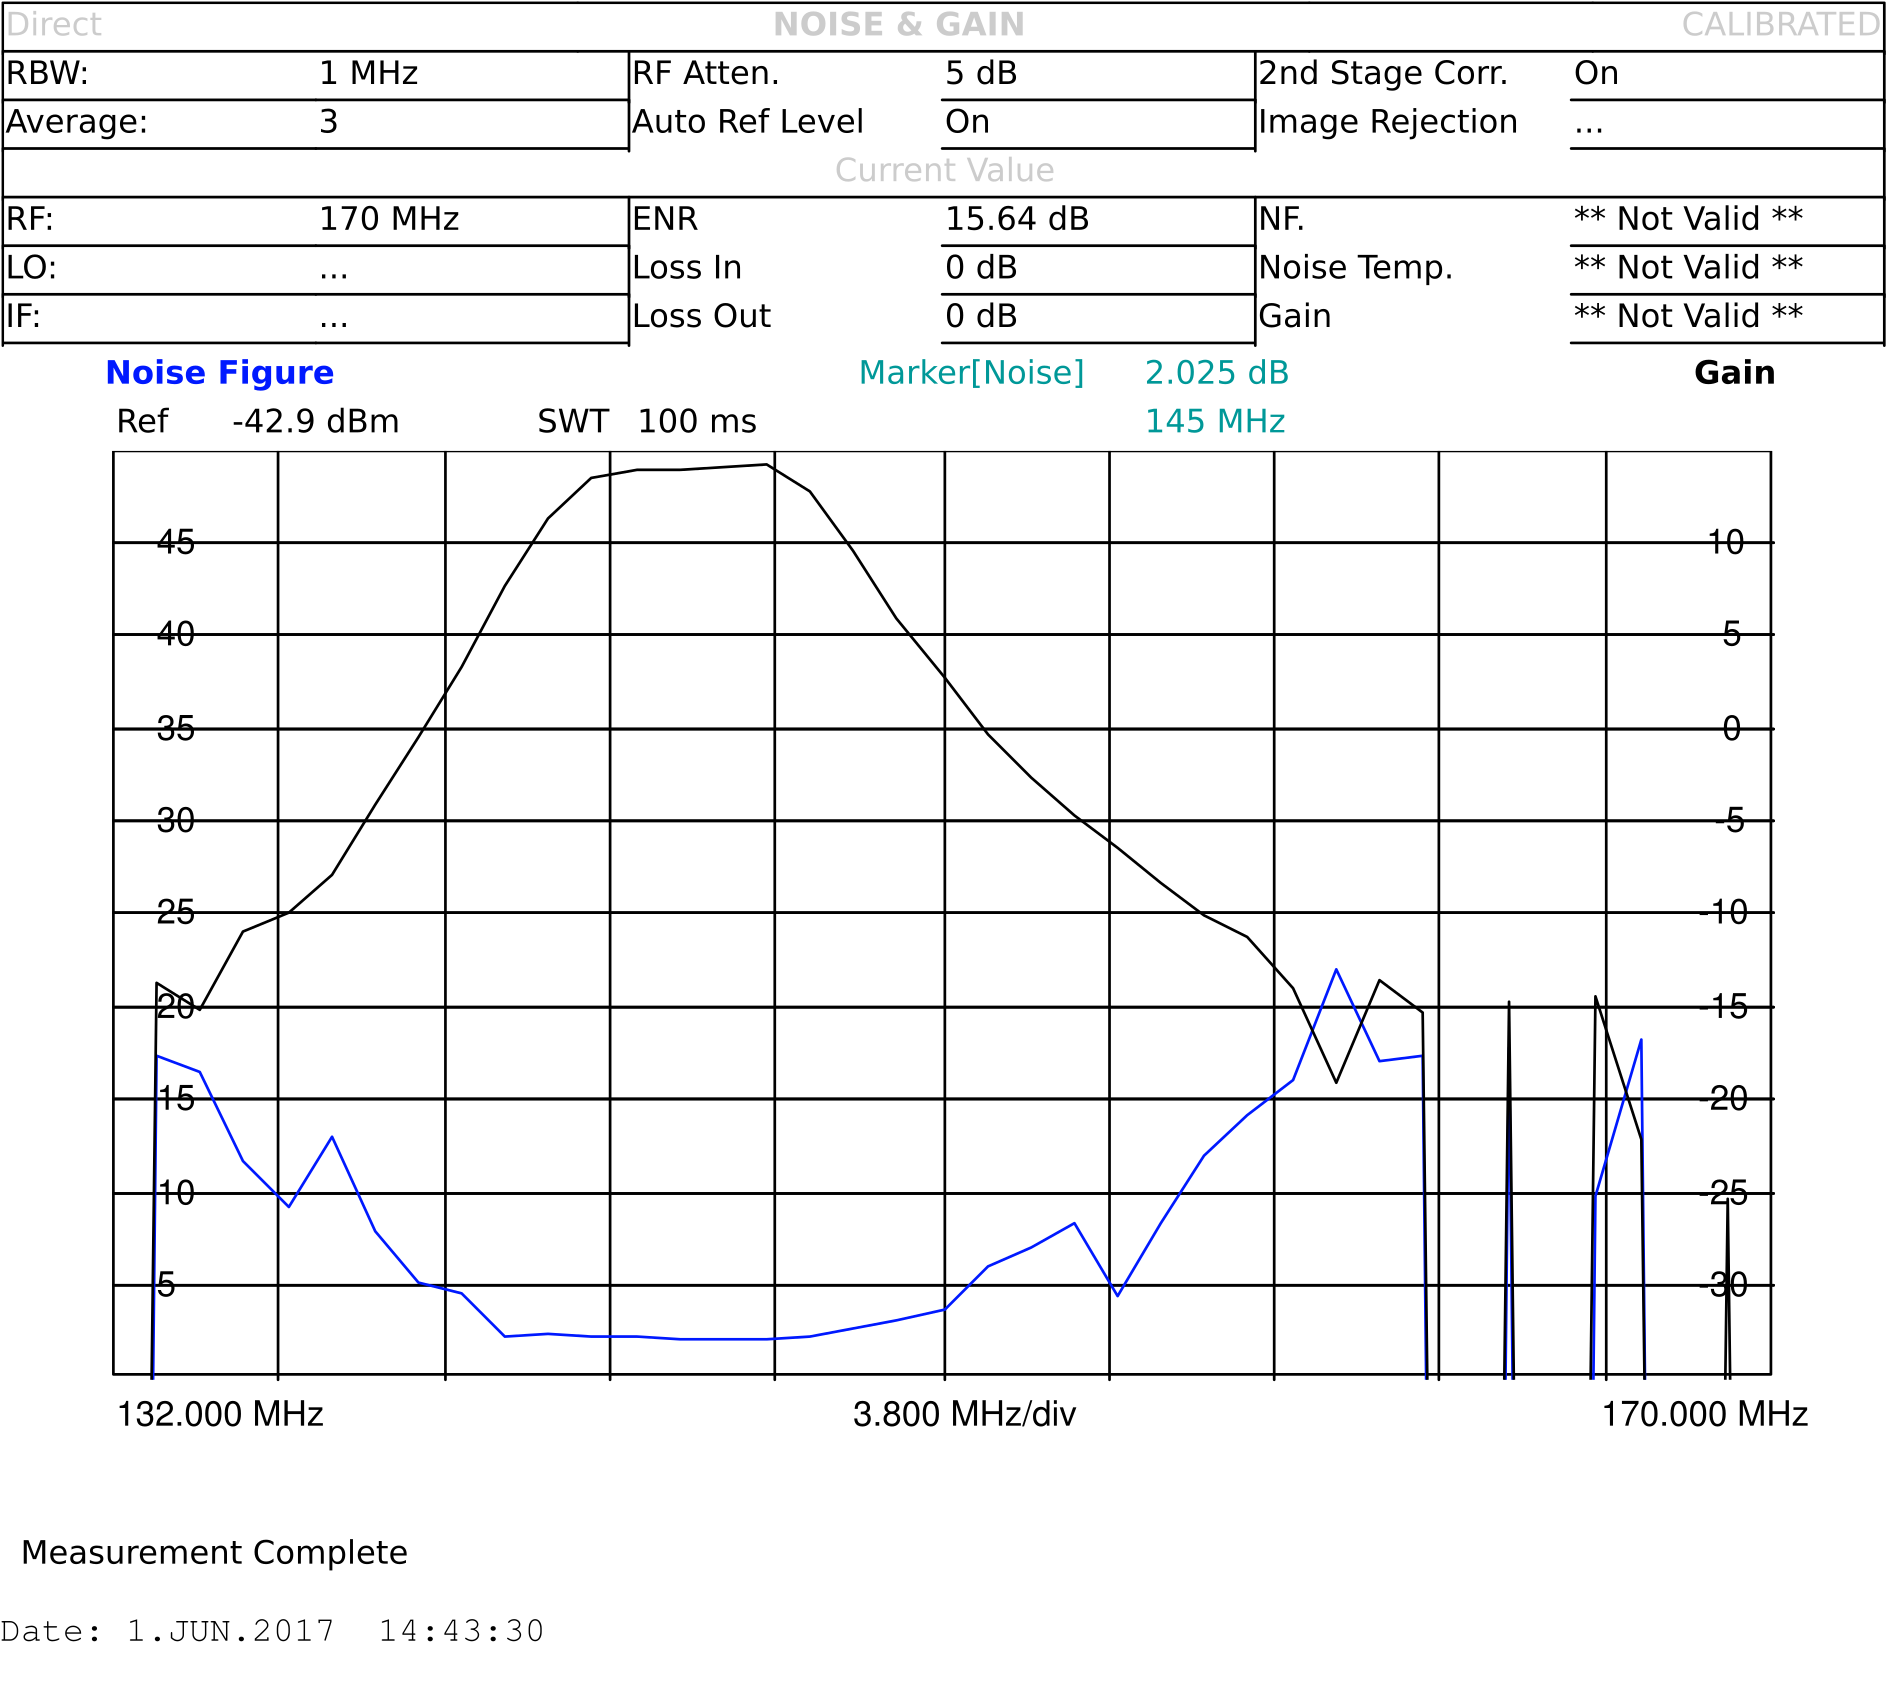
VHFDesign.com LNA 04-0m-v.03
VHFDesign.com LNA 04-0m-v.03
VHFDesign.com 2m LNA
Gain: 23.58 dB
Noise figure: 0.52 dB
Low fundamental tone power (144.95 MHz) : -20.3 dBm
High fundamental tone power (145.05 MHz): -20.1 dBm
Low IM3 power (144.85 MHz): -97.3 dBm
High IM3 power (145.15 MHz): -96.6 dBm
Low side OIP3: 38.5 dB
High side OIP3: 38.25 dB
Low side IIP3: 14.92 dB
High side IIP3: 14.67 dB
Low side DR_f: 77 dB
High side DR_f: 76.5 dB
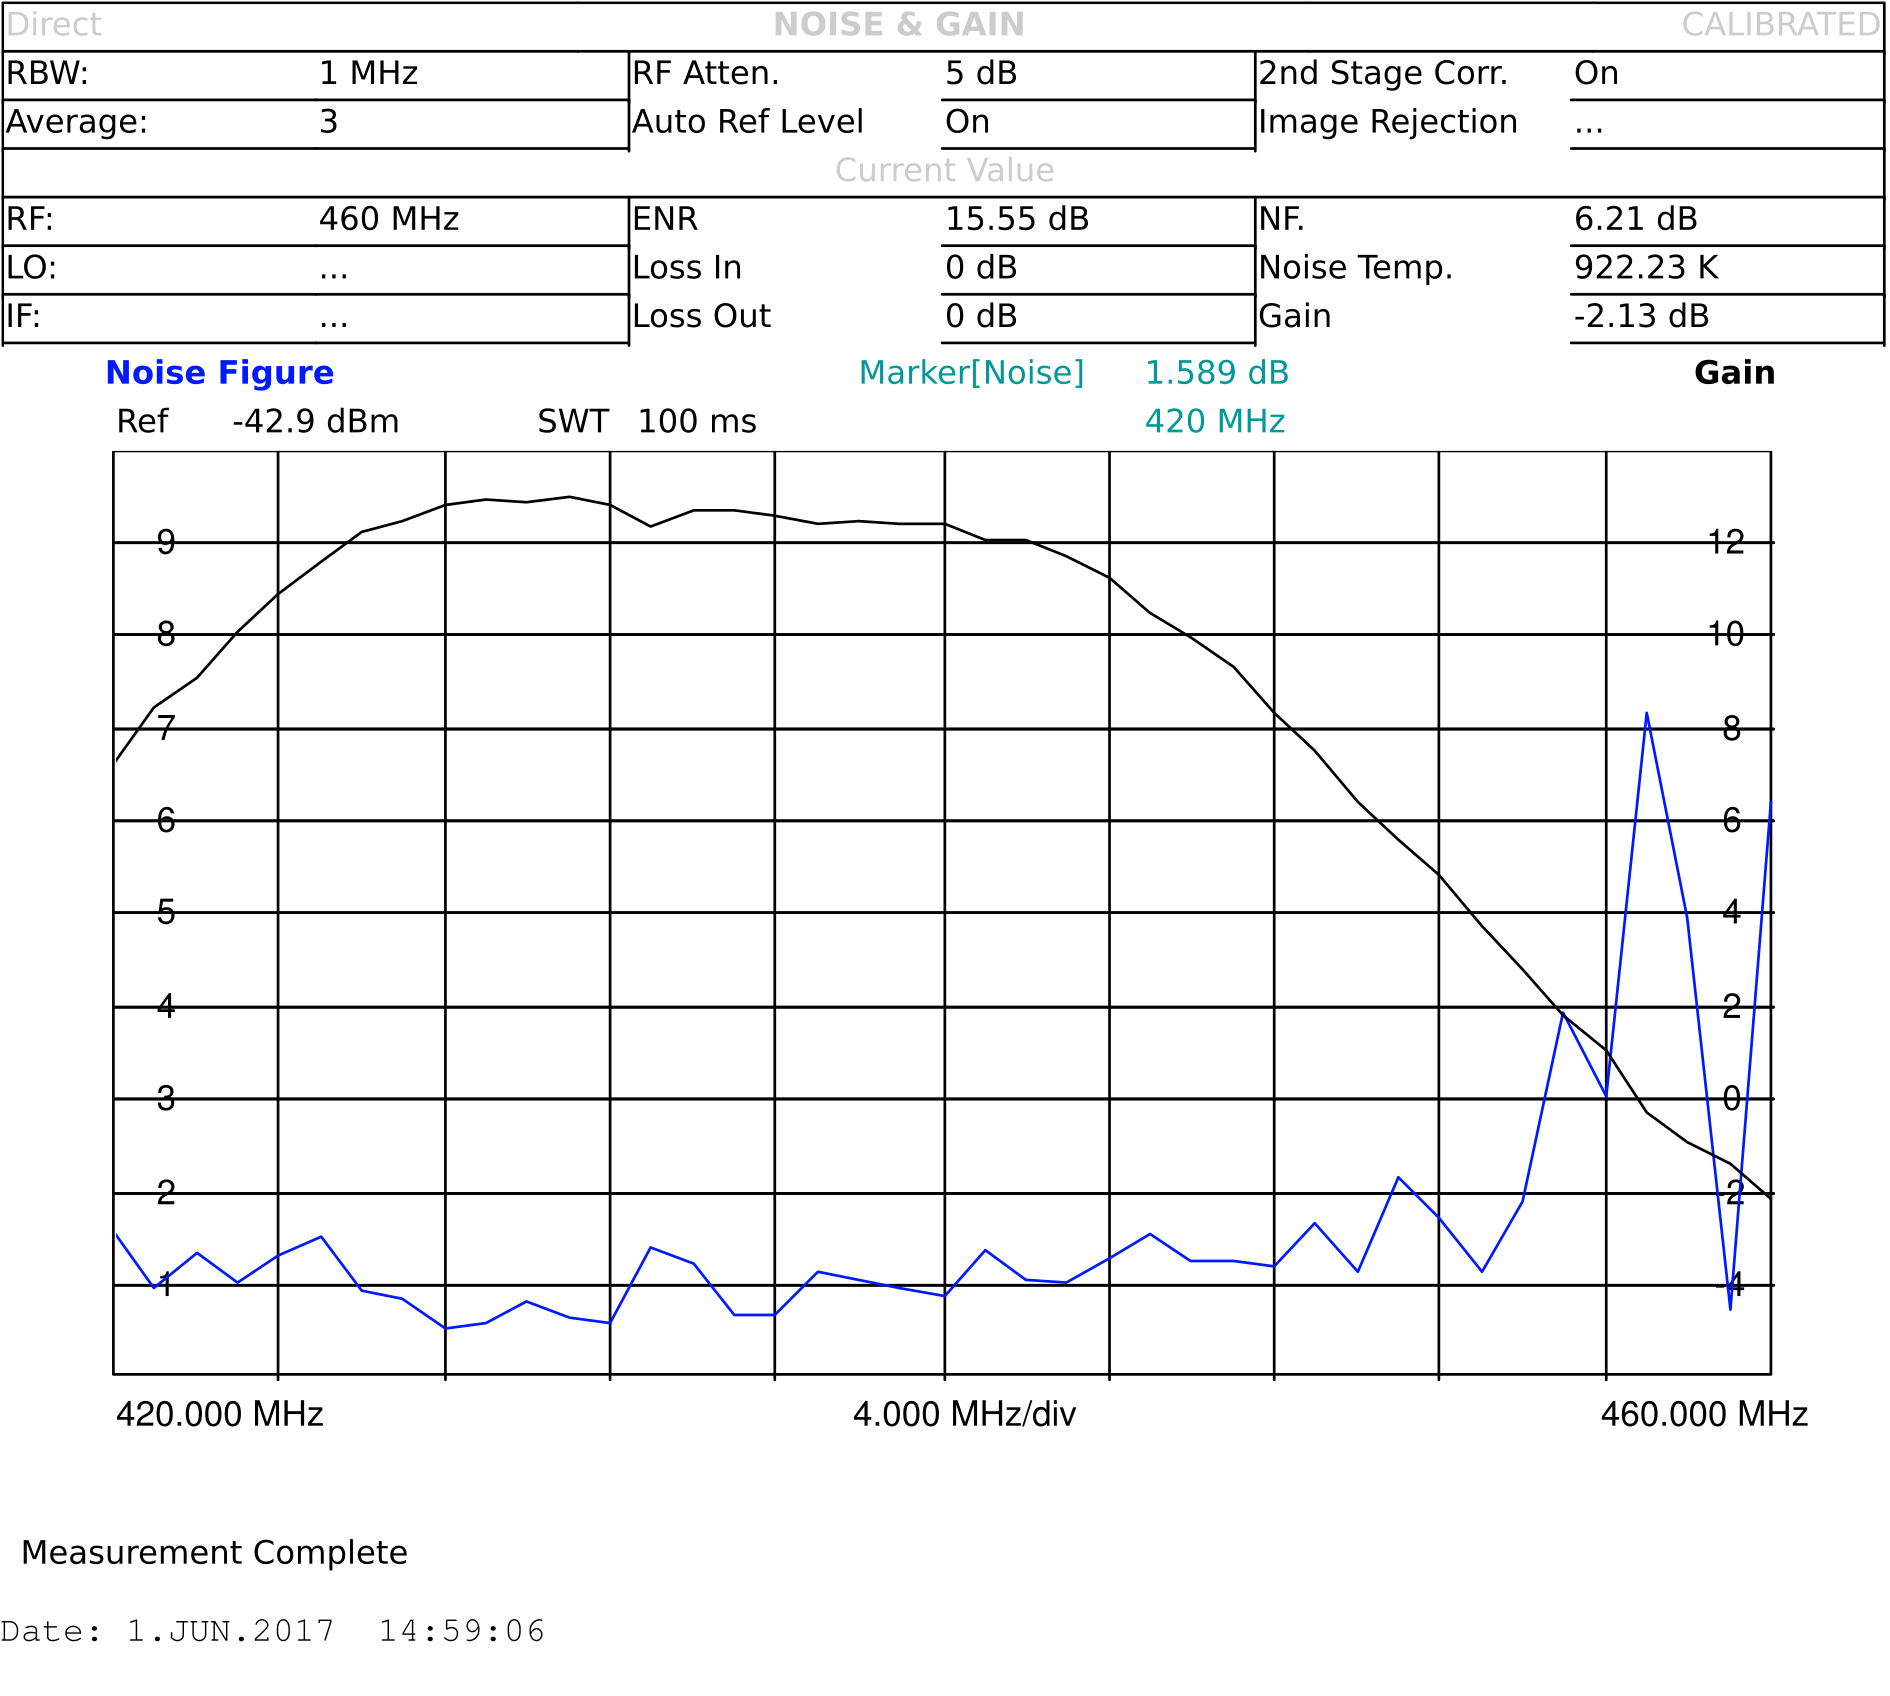
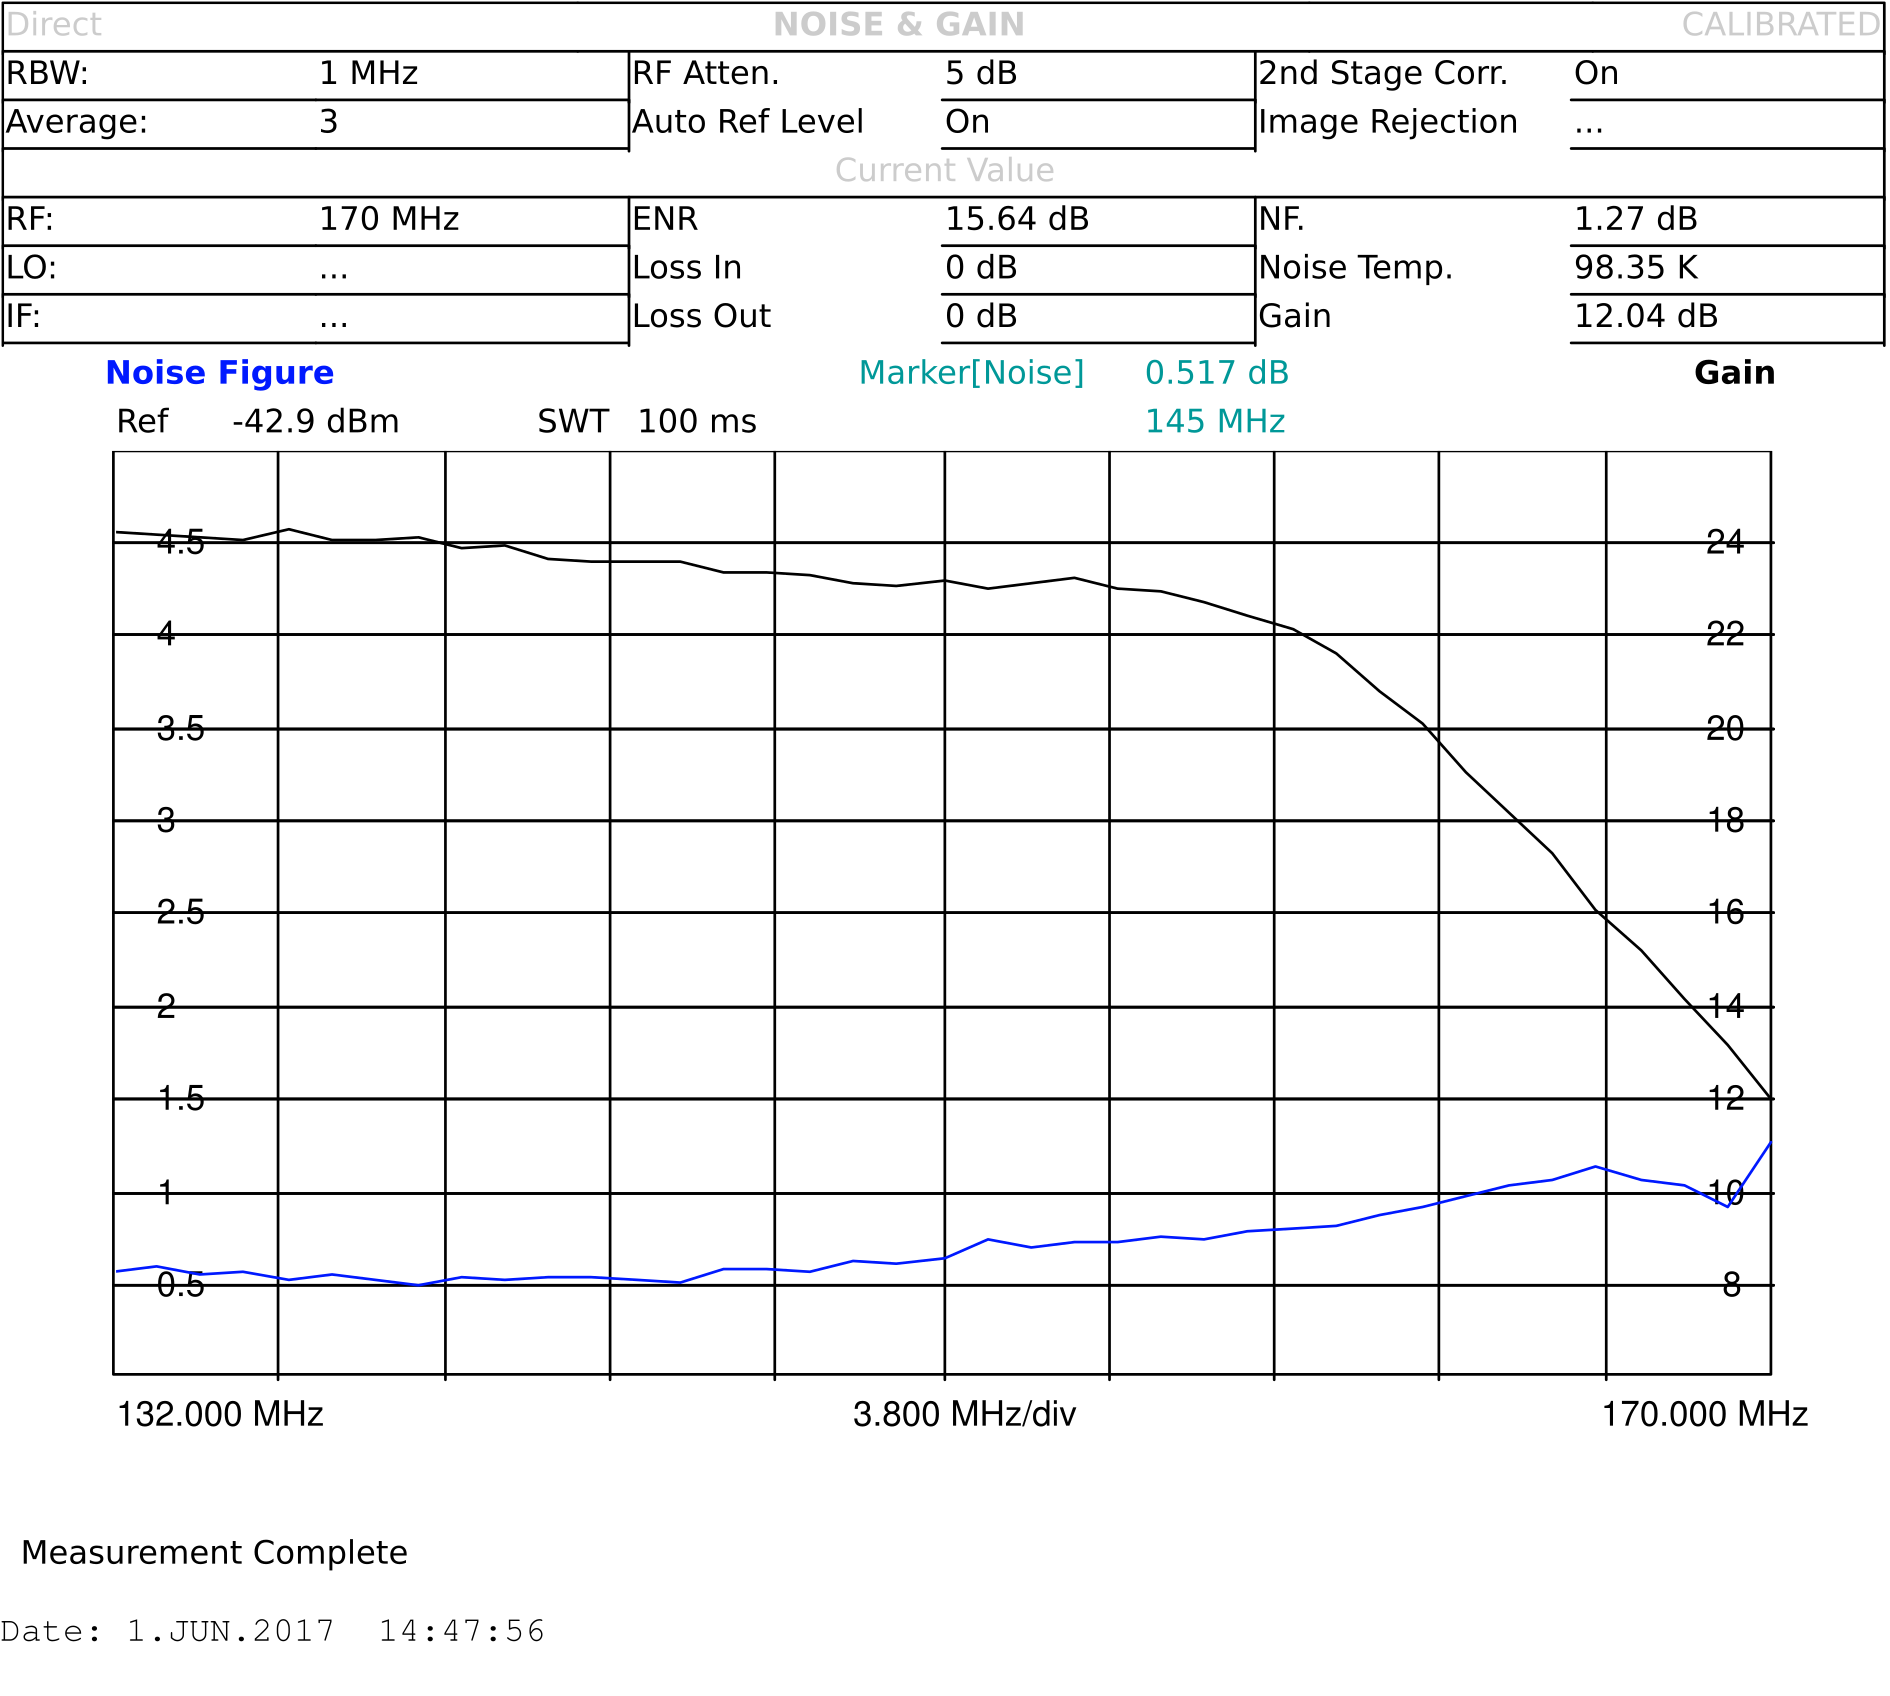
Kuhne MKU LNA 131 AH
Kuhne MKU LNA 131 AH
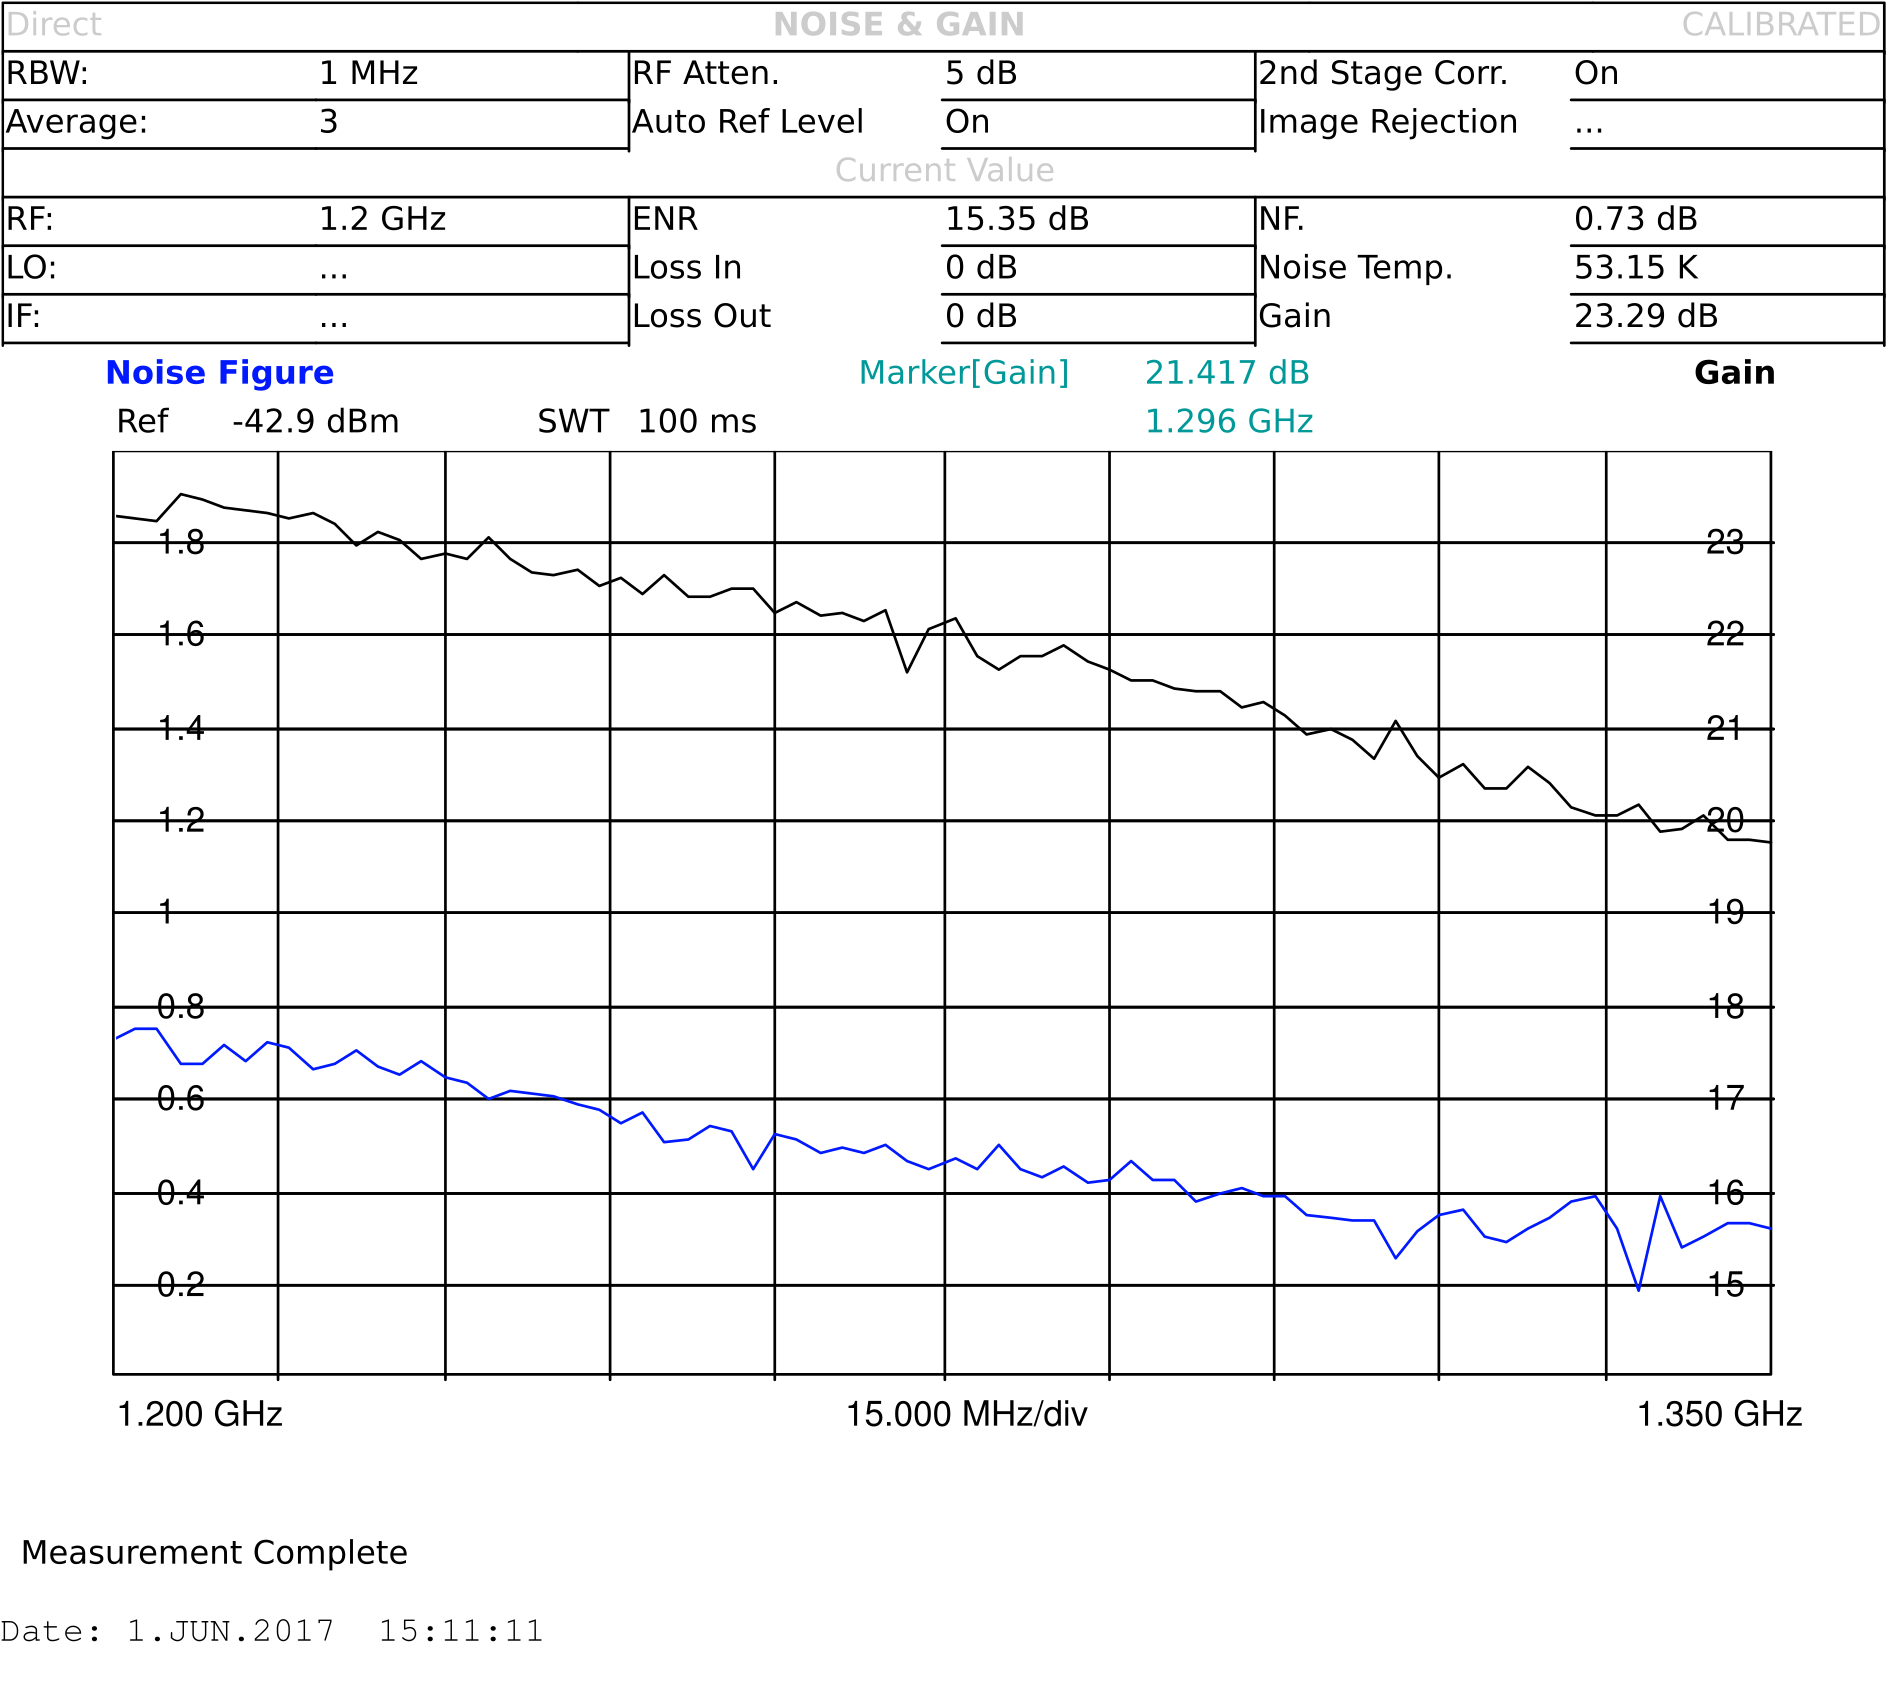
Kuhne 23cm LNA
Gain: 21.42 dB
Noise figure: 0.43 dB
Low fundamental tone power (1294.95 MHz) : -23.18 dBm
High fundamental tone power (1295.05 MHz): -23.21 dBm
Low IM3 power (1294.85 MHz): -94.5 dBm
High IM3 power (1295.15 MHz): -102.2 dBm
Low side OIP3: 35.66 dB
High side OIP3: 39.5 dB
Low side IIP3: 14.24 dB
High side IIP3: 39.5 dB
Low side DR_f: 71.32 dB
High side DR_f: 78.99 dB
LNA4ALL
LNA4ALL
The IP3 is found to be on average 34.75 dB by measurements done by DG1TRF, these can be found on the LNA4ALL product page. Below is the noise and gain measurements from 30 MHz to 2 GHz measured with 5 V supply.
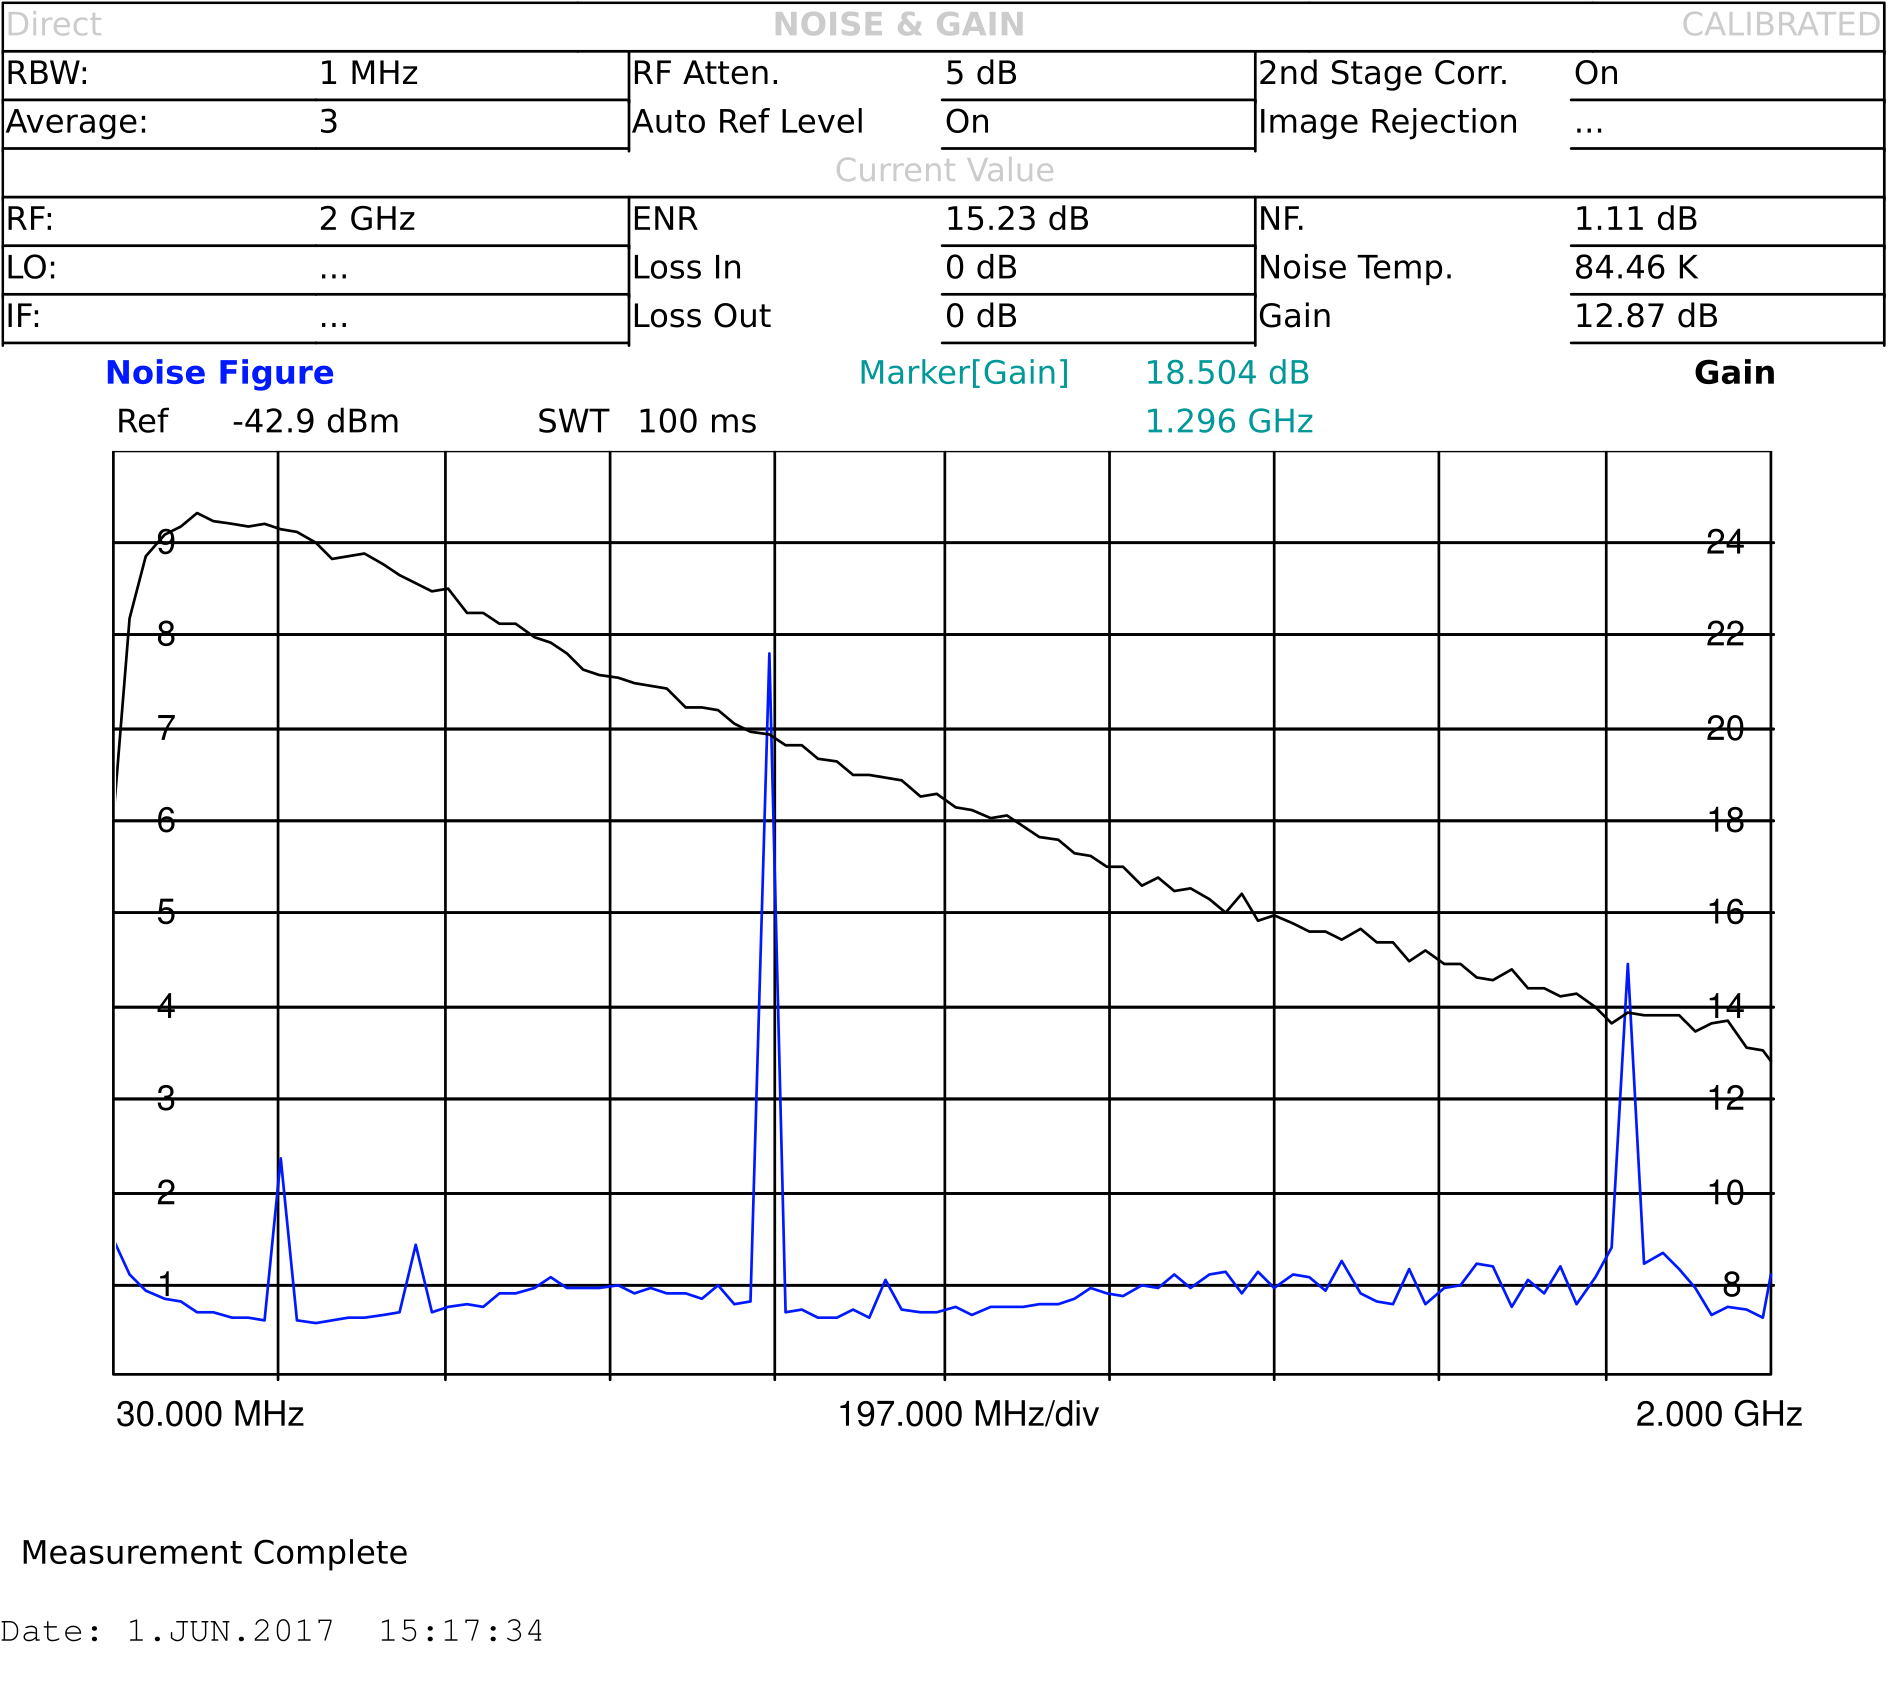
LNA4ALL gain and noise figure

Please repeat IP3 measurements for higher output tone. Your IP3 results are too optimistic, even for Kuhne LNA 131AH device with 15mA drain current.
Thanks for your comment 🙂
Seems like this could be a one-size-fits-all problem. Since the measurement was repeated with the same settings across many LNAs, I might’ve gotten sloppy with checking the results. Unfortunately we don’t have these amplifiers around anymore (they were loaned from various places), so I won’t be able to re-validate.
I don’t agree in increasing the tone power in this setup though, as it would drive the weaker amplifiers into compression. IMD characteristics should strictly speaking be swept vs tone power, in order to quantify the interesting region, but that would be too time consuming for these short measurements. It’s a good idea for a future blog post though 🙂
73 de Øyvind/LA3WUA
Indeed, the input signal should not be pushed up to the compression point.
0…7dm output tone should not be a problem if the LNA really is capable of such a good IMD figure.
It is also a good practice to repeat the measurement by changing the input level +/- several dB. This can confirm that the errors are small.
For example “Kuhne LNA 131AH” no has IP3 specification because it is a regular LNA (only 15mA current can say many things about IP3…). The high IP3 version “Kuhne LNA 132 AH” has 80mA and OIP3=+27dBm according Kuhne datasheet. OIP3 around of 38dB, IIP3 around of 14dBm are too beautiful to be true.
I do not have these LNAs available on my desk, so i can’t say true or false 🙂
All the best,
73 de Robert/YO4HFU